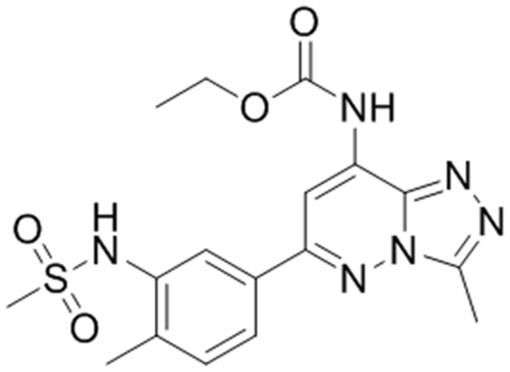
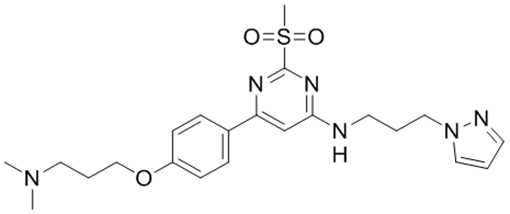
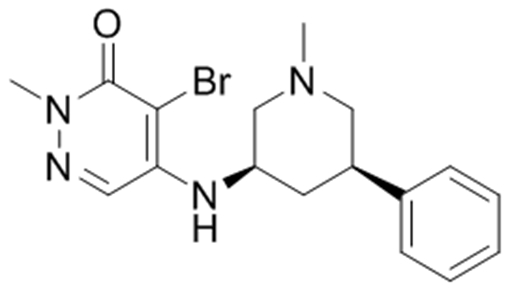
Table 1:
Comparison of PrOF NMR and SPR Kd with AlphaScreen IC50 values for the BPTF bromodomain
| Ligand |
 1, Bromosporine |
 2, TP-238 |
 3, GSK4027 |
|---|---|---|---|
| aReported BPTF Kd | 1.8 μM35 | 120 nM† | 130 nM36 |
| 5FW-BPTF PrOF NMR Kd | 37 μM | * | * |
| 5FW-BPTF SPR Kd | 19 ± 3 μM | 250 ± 20 nM | 2.3 ± 0.2 μM |
| aBPTF SPR Kd | 9 ± 1 μM | 200 ± 10 nM | 1.7 ± 0.1 μM |
| aBPTF AlphaScreen IC50 | 10 μM | 430 nM | 1.5 ± 0.2 μM |
AlphaScreen and SPR values were an average of duplicate measurements, except for TP-238 (2) where the SPR value was an average of triplicate measurements and the AlphaScreen value for 3 which is an average of six experimental replicates.
Indicates the unlabeled BPTF protein was used, otherwise the 5FW-labeled protein was used.
Indicates molecules entered intermediate/slow exchange and Kd values could not be determined.
Value reported on thesgc.org.
