Table 3:
Panel of small molecules tested in PrOF NMR, SPR, and AlphaScreen assays.
| Ligand | PrOF NMR Kd (μM) | BPTF SPR Kd (μM) | 19F BPTF SPR Kd (μM) | BPTF AlphaScreen IC50 (μM) |
|---|---|---|---|---|
4
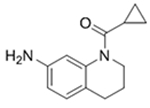
|
175 | 230 ± 50 | 280 ± 70 | 200a |
5
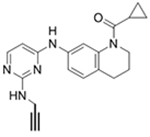
|
* | NSB | NSB | 36a |
6

|
7† | 41 ± 9 | 26 ± 10 | 19b |
7
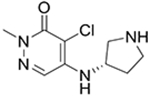
|
* | 25 ± 10 | 19 ± 13 | 31b |
8
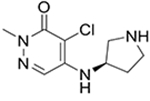
|
20† | 6 ± 2 | 3 ± 1 | 10 ± 2b |
9
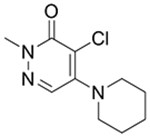
|
330† | Bound to reference | Bound to reference | NB |
indicates molecules entered intermediate exchange and Kd values could not be determined
represents molecules with broadened resonances or a small dynamic range making quantification less accurate.
indicates compound was insoluble at high concentration. PrOF NMR Kd values were determined from a single titration. SPR Kd values were based on data collected in triplicate using His9-tagged BPTF bromodomain. NSB indicates that molecules bound non-specifically and 1:1 binding isotherms could not be generated. Bound to reference indicates molecule bound to chip surface at high ligand concentrations and Kd could not be determined. AlphaScreen IC50 values were reported as the average of technical duplicates except for 8 which is an average of three experimental replicates.
Molecules were tested in the presence of 0.5% DMSO.
Molecules were tested at 0.25% DMSO. NB indicates non-binding up to 250 μM of compound.
