
Figure 1.
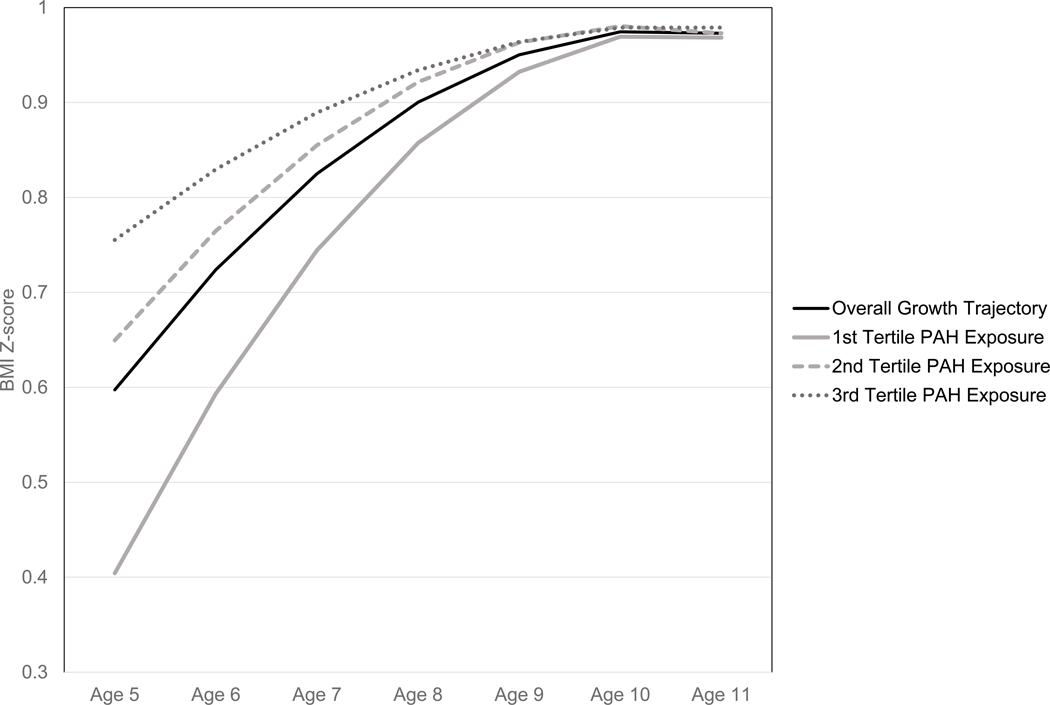
The solid black line represents the estimated mean BMI z-score for the entire study population from a regression model that includes the variables age and age2. The solid grey, dashed grey and dotted grey lines represent the covariate adjusted, estimated BMI Z-scores derived from Model 2 by tertile of prenatal airborne exposures to PAH.