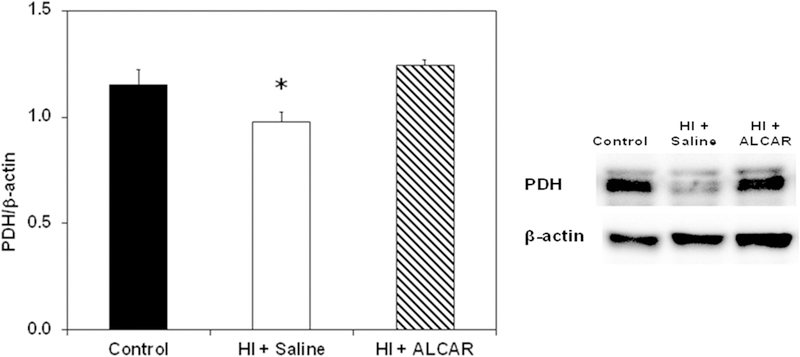
Figure 3.

Ratio of pyruvate dehydrogenase (PDH) to β-actin in kidney from sham control (black bar), HI + saline (white bar) and HI + ALCAR (hatched bar) rat pups 24 h after HI. Western blot of proteins is shown on the right. The primary antibody was against the PDH E1-α subunit. PDH levels in HI + saline pups were different than control (p < 0.05) and HI + ALCAR (p < 0.01) pups. Values are mean ± SEM for 14 controls, 14 HI + saline and 6 HI + ALCAR pups. Data were analyzed by ANOVA and Bonferroni post hoc test
