Figure 5.
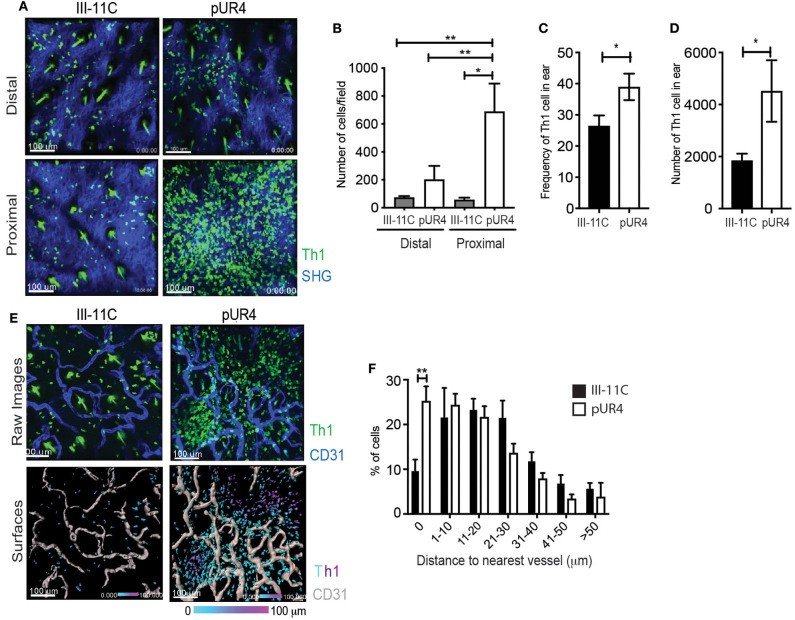
Perivascular Th1 cell accumulation in the pUR4-treated inflamed dermis. Adoptively transferred Kaede+ Th1 cells were imaged by IV-MPM in the pUR4 or III-11C-treated dermis day 3-post OVA/CFA immunization. (A) Representative images of Th1 cells accumulation proximal and distal to the pUR4 or III-11C injection site. Th1 cells (green), SHG (blue), scale bar 100 μm. (B) Quantitation of the number of Th1 cells in the imaging field, statistics by ANOVA. (C,D) Enumeration of Thy1.1+ transferred Th1 cells by Flow cytometry. Frequency of Th1 cells within the CD4+ population (C) and number (D) of Thy1.1+ cells in the pUR4 or III-11C-treated dermis day 3-post OVA/CFA immunization, statistics by unpaired t-test. (E) Representative images of Th1 cell position relative to CD31+ blood vessels, proximal to the pUR4 or III-11C injection site. AF647-labeled CD31 Ab administered i.v. immediately prior to imaging. Top, raw images; Th1 cells (green), SHG (blue), scale bar 100 μm. Bottom, 3D surfaces of vessels (gray) generated in Imaris and cells color coded based on distance to the nearest vessel. (F) Quantitation of the frequency of Th1 cells relative to the distance to the nearest blood vessel in the pUR4 or III-11C-treated dermis day 3-post OVA/CFA immunization. Statistics by two-way ANOVA, *p < 0.05, with Sidak's multiple comparisons **p < 0.01. Two to three independent experiments.

