
Figure 1: Osterix-Cherry mice allow for tracking of pre-osteoblastic / mesenchymal cells in vivo.
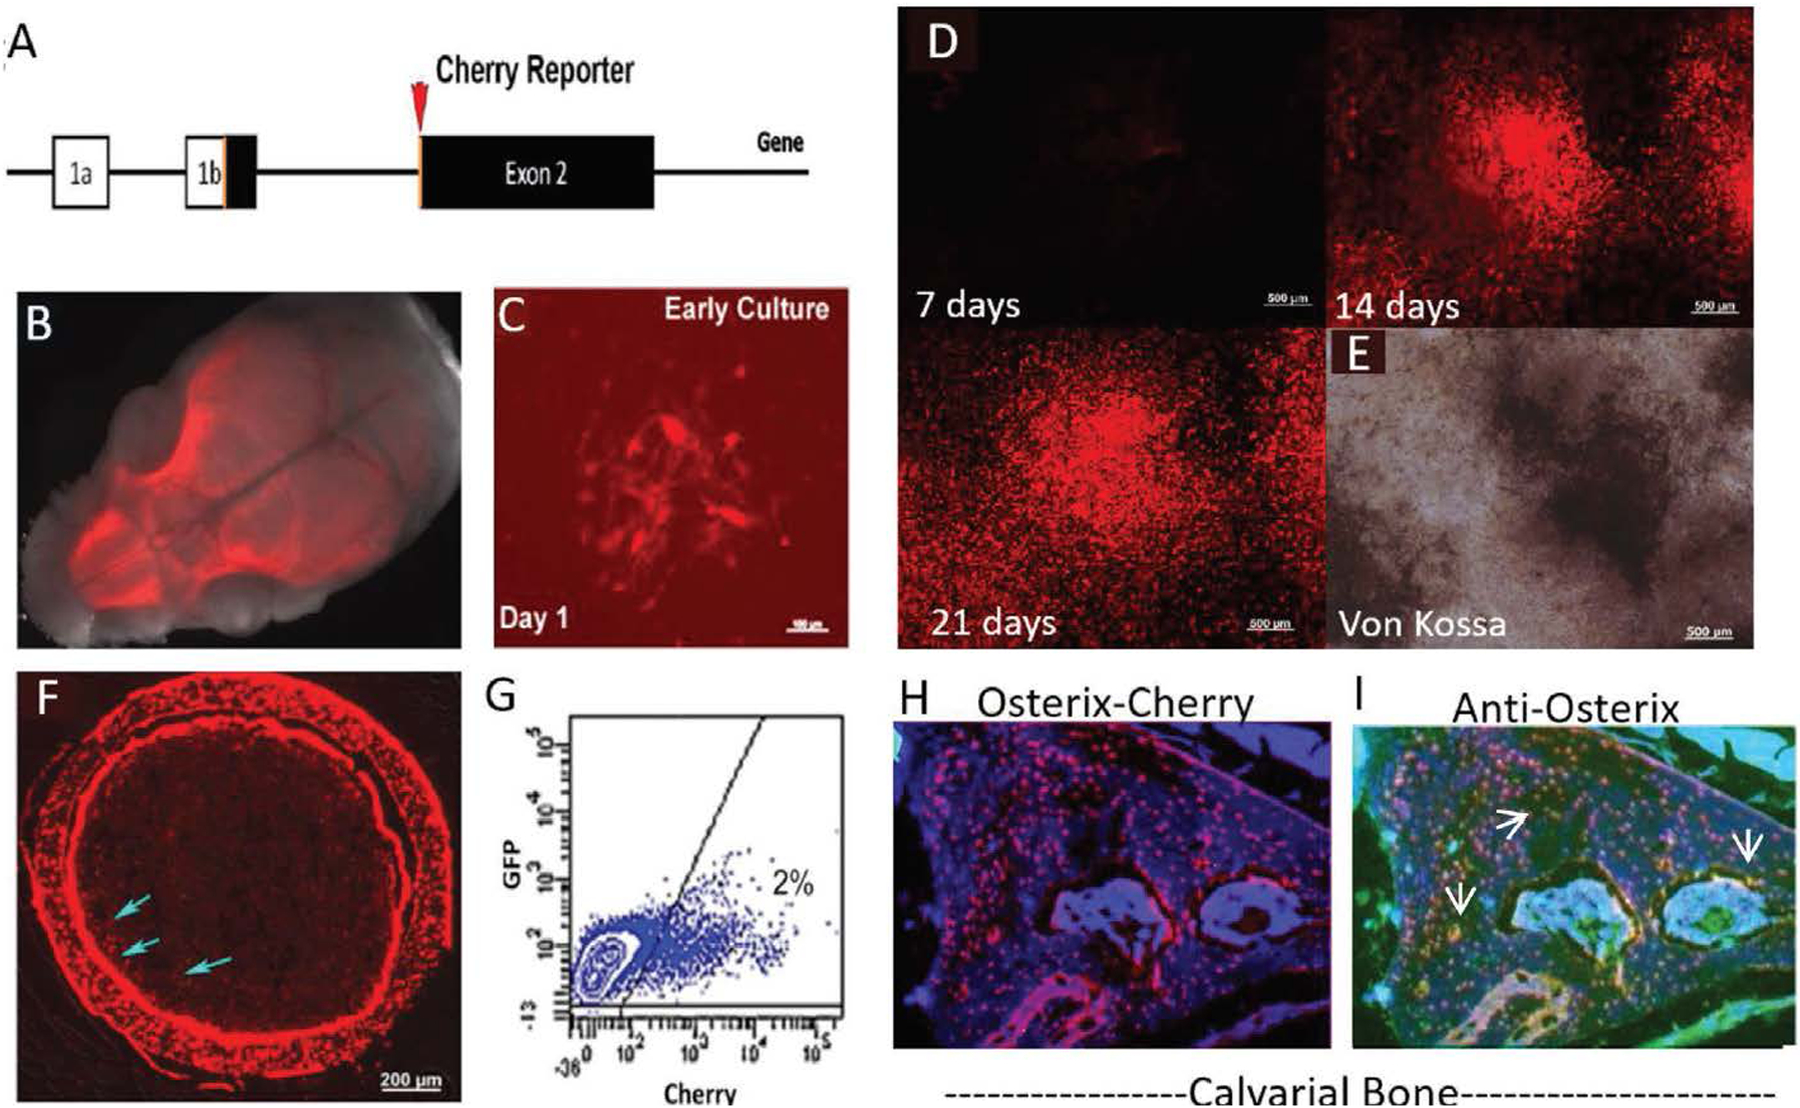
(A) Osterix-mCherry reporter construct showing the location of the fluorescent reporter in relation to the translational start site. (B) Whole mount skull from P2 Osterix-mCherry reporter mouse indicating fluorescence is localized to skeletal tissue. (C) Culture of bone marrow stromal cells (BMSC), showing colonies of mCherry cells after 24 hours in vitro (scale bar = 50μm). (D) Time course of BMSC culture with consistent 15ms exposure time confirming increasing brightness of colonies (scale bar = 500μm). (E) Mineralization by von Kossa at 21 days correlating with bright Osterix-mCherry expression (scale bar = 500μm). (F) Cortical section showing Osterix-mCherry expression within Osteoblasts, Osteocytes and mesenchymal stem cells (blue arrows) (scale bar = 200μm). (G) Flow of freshly isolated bone marrow showing 2% of the cells are positive for mCherry expression. (H) Calvarial section showing Osterix-mCherry expression within the bone. (I) Same calvarial section seen in H, immunostained for Osterix using a green secondary antibody, showing co-localization with H (white arrows, yellow cells).