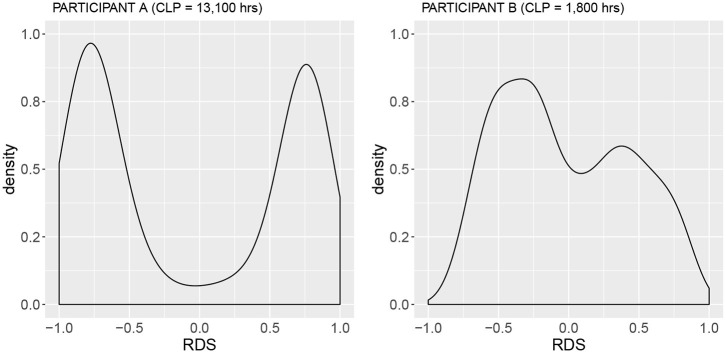
Figure 3.
Density plots of the RDS signal for Participant A, Cumulative Lifetime Practice, CLP = 13,100 h, sdRDS = 0.74 and Participant B, Cumulative Lifetime Practice, CLP = 1,800 h) sdRDS =0.46. RDS signals from both plots were derived from the single right-hand only exercise (RHSolo) at 400 HPM (see Figure 2). Note the bi-modal distribution of Participant A, that accounts for the large standard deviation (sdRDS).

