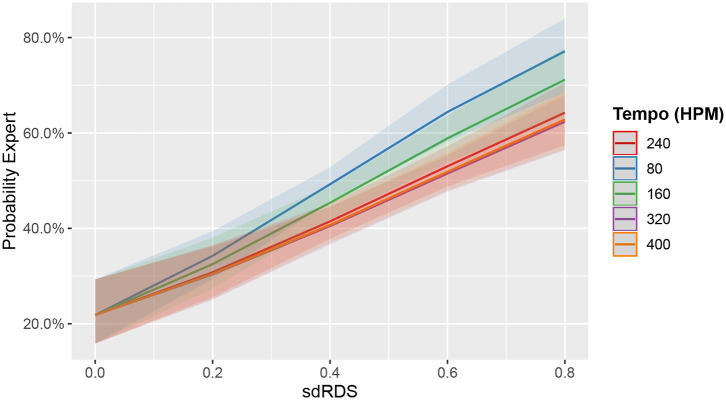
Figure 5.
Marginal effects plot of sdRDS and tempo on the predicted probability that an observation derives from an expert drummer. Line color indicates tempo. The 240 HPM tempo is at the top of the legend, as it represents the model's baseline. The model attributes higher sdRDS to drumming expertise. This is particularly visible at 80 HPM (blue line), which shows the steepest slope. Bands represent 95% CIs.

