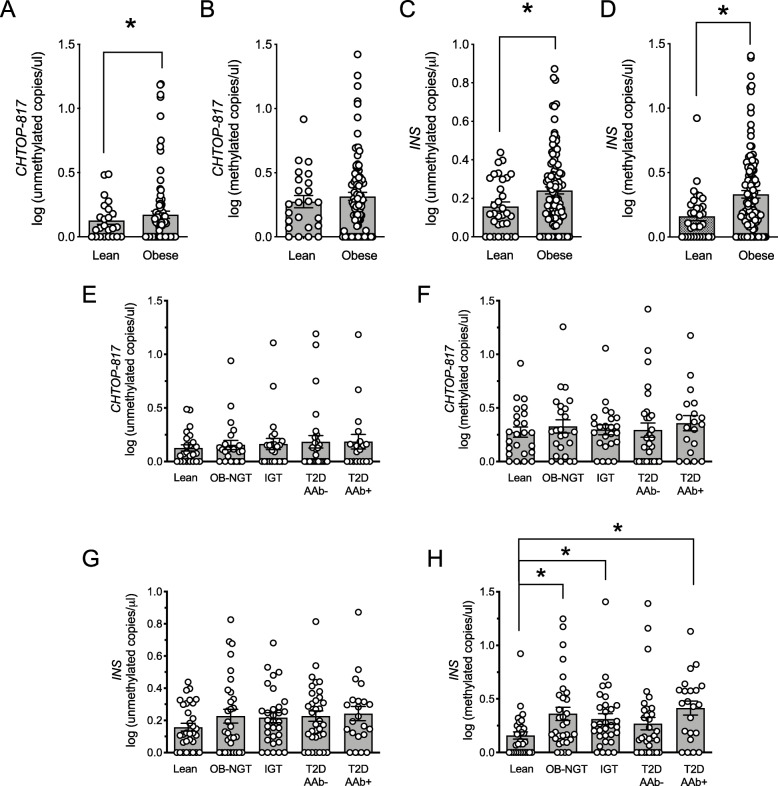
Fig. 6.
Circulating CHTOP-817 and INS DNA levels in youth with obesity with or without T2D. DNA was isolated from serum, bisulfite-converted, and differentially methylated CHTOP-817 and INS levels were measured by droplet dPCR. a Log of circulating unmethylated CHTOP DNA levels in lean and obese youth; b log of circulating methylated CHTOP DNA levels in lean and obese youth; c log of circulating unmethylated INS DNA levels in lean and obese youth; d log of circulating methylated INS DNA levels in lean and obese youth; e–h log of circulating unmethylated CHTOP-817 (e) and INS (g) and methylated CHTOP-817 (f) and INS (h) DNA levels in lean youth with normal glucose tolerance (NGT) and youth with obesity and normal glucose tolerance (OB-NGT), obesity and impaired glucose tolerance (IGT), and clinician-diagnosed obesity with T2D without (T2D-AAb−) and with (T2D-AAb+) autoantibodies. Data are presented as mean ± SEM. *P < 0.05 for the comparisons indicated

