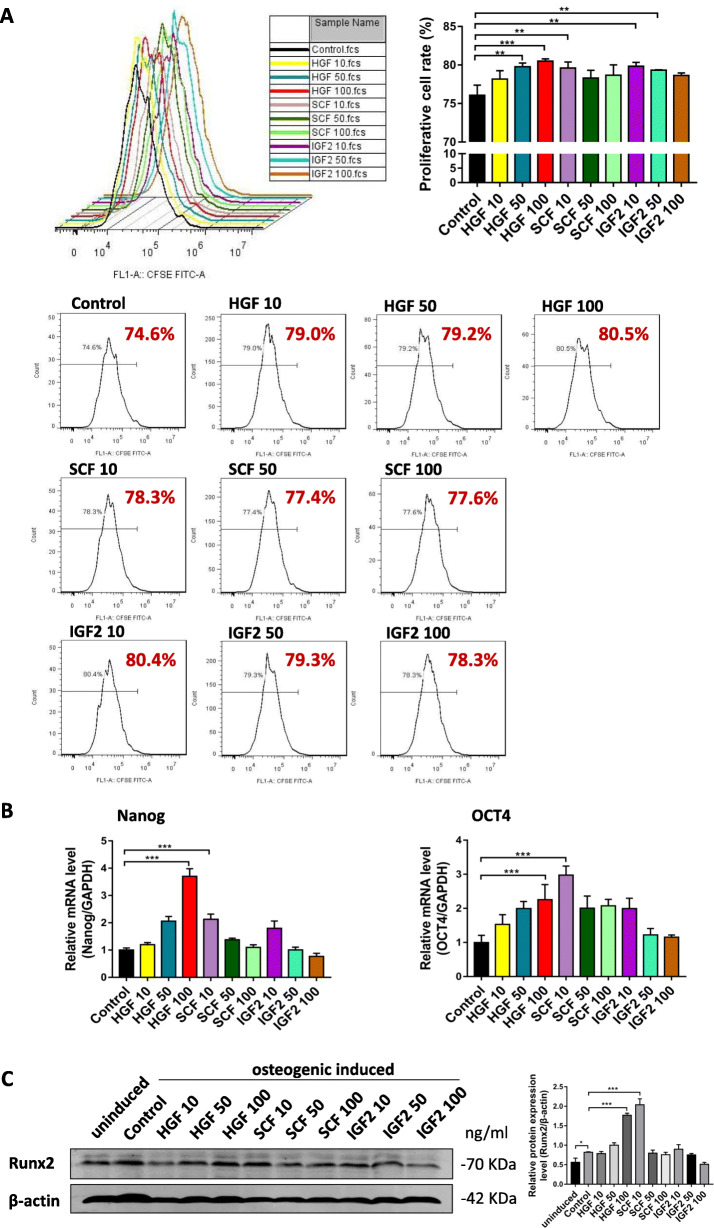
Fig. 4.
Identification of key factors and determination of effective concentrations. a Flow cytometry results and individual graphs of CFSE assay, and corresponding proliferative cell rate (%) of hBMSCs treated with 10 ng/ml HGF (HGF 10), 50 ng/ml HGF (HGF 50), 100 ng/ml HGF (HGF 100), 10 ng/ml SCF (SCF 10), 50 ng/ml SCF (SCF 50), 100 ng/ml SCF (SCF 100), 10 ng/ml IGF2 (IGF2 10), 50 ng/ml IGF2 (IGF2 50), and 100 ng/ml IGF2 (IGF2 100) compared to the control. c Relative mRNA expression levels of stemness markers, Nanog and OCT4, per treatment group. e Western blot results and corresponding relative expression level of Runx2 protein per treatment group after 7 days of osteogenic induction. *P < 0.05, **P < 0.01, ***P < 0.001

