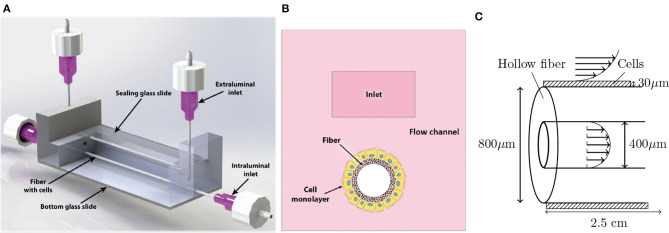
Figure 1.
Overview of the experimental setup. (A) The microfluidic chip with the in- and outlets as well as the fiber and transparent glass top and bottom. Fluid flow is driven by a peristaltic pump that is separately connected to the intra- and extraluminal inlets and outlets. (B) Cross section of the microfluidic chip. (C) Detailed view of the fiber and cells. The patterned domain indicates the cell layer, on which the fluid exerts a shear stress. The fluid velocity is indicated with the arrows inside and around the fiber. The steady flow rates in this device will be of order Q0 = 125μL/min. Note that the figures are not to scale.

