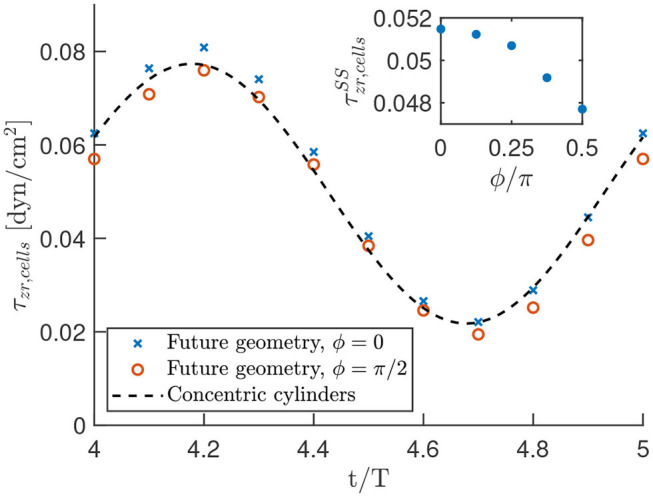
Figure 10.

Oscillating shear stress on the cells in the optimal geometry as a function of time. The data points result from the numerical calculations in COMSOL, while the black dashed line is the analytic prediction in a concentric cylinder geometry. These results are obtained with the parameter settings as described in the section 2 and oscillation period T = 0.1s. The shown shear stress is the sum of a steady and a time-harmonic contribution. The inset highlights the steady state shear stress on the cells for various values of ϕ/π to indicate the homogeneity of the shear stress.
