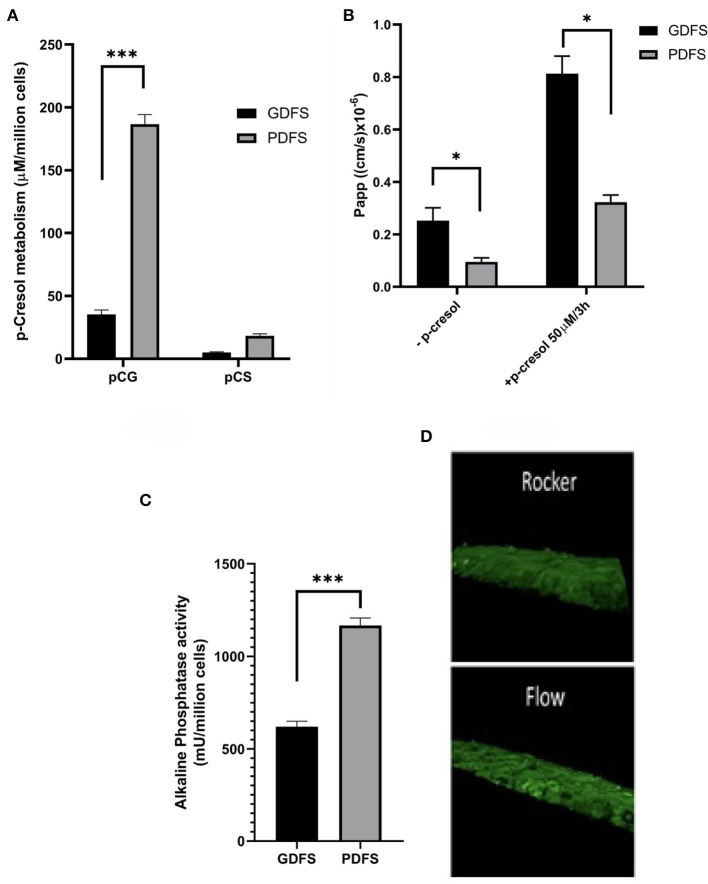
Figure 7.
Functional analysis of Caco-2 cells in GDFS vs. PDFS. PDFS exhibited higher p-cresol metabolic capacity into p-cresol glucuronide (pCG) and p-cresol sulfate (pCS) (A), tighter monolayer formation (B), improved brush border activity (C) and better differentiation in terms of villi formation (D). Data are shown as mean ± SD, n = 2–4. *p < 0.05; ***p < 0.001.

