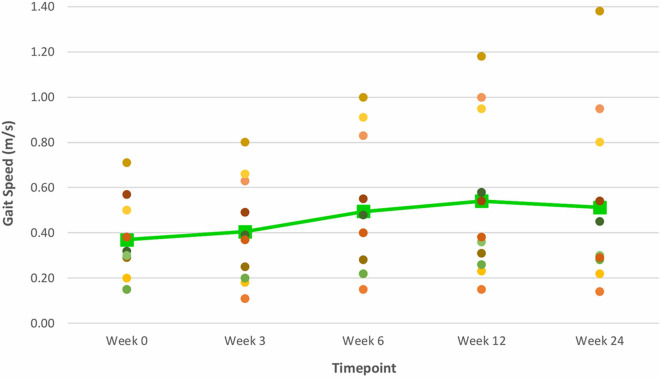
Figure 7.
Time series plot showing the primary outcome measure of gait speed (as measured by the 10 MWT). Each circle • represents a study subject. A trend line (–) has been superimposed to illustrate the change in the mean ± SD gait speed from baseline pre-intervention (i.e., Week 0) to final follow-up post-intervention (i.e., Week 24).

