
Figure 1.
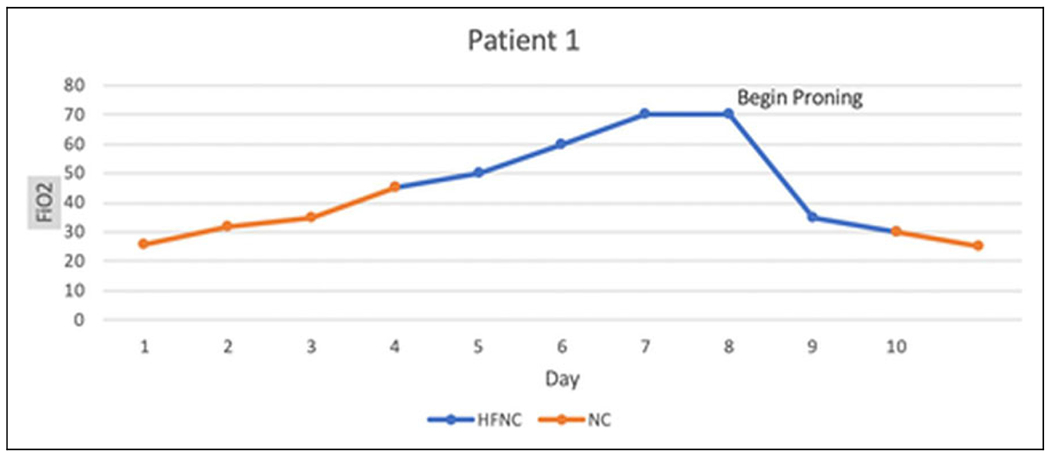
FiO2 (y-axis) on different days (x-axis). Orange line shows patient on NC. Blue line shows patient on HFNC. L/min on NC has been converted to approximate FiO2. HFNC indicates high-flow nasal cannula; NC, nasal cannula.
Official websites use .gov
A
.gov website belongs to an official
government organization in the United States.
Secure .gov websites use HTTPS
A lock (
) or https:// means you've safely
connected to the .gov website. Share sensitive
information only on official, secure websites.
FiO2 (y-axis) on different days (x-axis). Orange line shows patient on NC. Blue line shows patient on HFNC. L/min on NC has been converted to approximate FiO2. HFNC indicates high-flow nasal cannula; NC, nasal cannula.