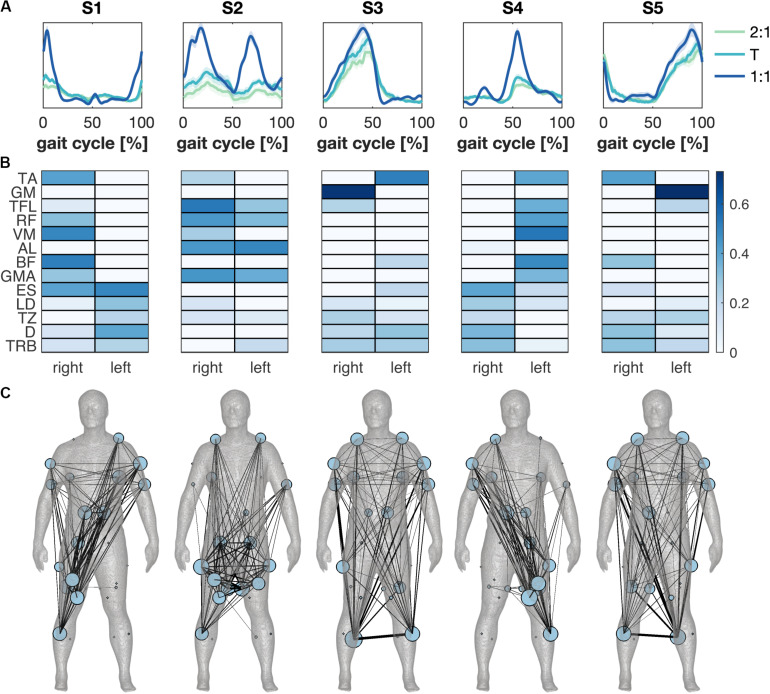
FIGURE 3.
Muscle synergies across modes of coordination. (A) The synergies’ temporal activation patterns as a function of the gait cycle derived from average muscle activity patterns for the different modes of coordination. Green, cyan and blue represent the 2:1, transition (T) and 1:1 mode of coordination. Error patches represent the standard error of the mean across subjects. (B) Synergies’ weightings across conditions and subjects in color scale. (C) Muscle synergy network plotted separately for each synergy on the body mesh (Makarov et al., 2015). A minimally-connected network was created for visualization. Node size represents the degree of the muscle and edge thickness represents weighted appearance of both muscles in the synergy.

