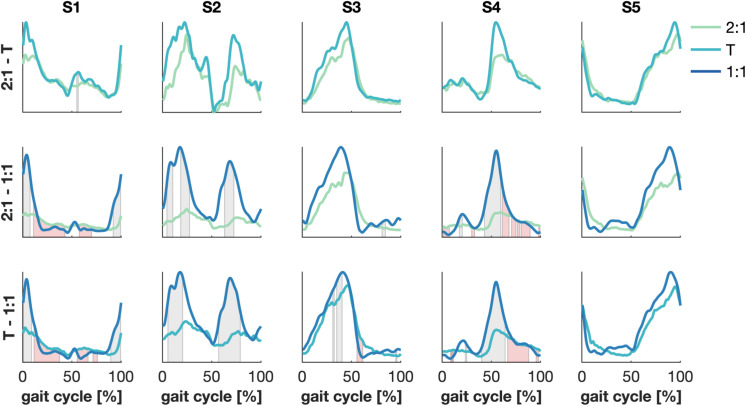
FIGURE 4.
Significant differences between synergies’ wave forms between modes of coordination. Green, cyan and blue represent 2:1, transition (T) and 1:1, respectively. Patches represent significant differences in time between the amplitude (gray) and the temporal patterns (red) of the synergies’ wave forms. α = 1/300.

