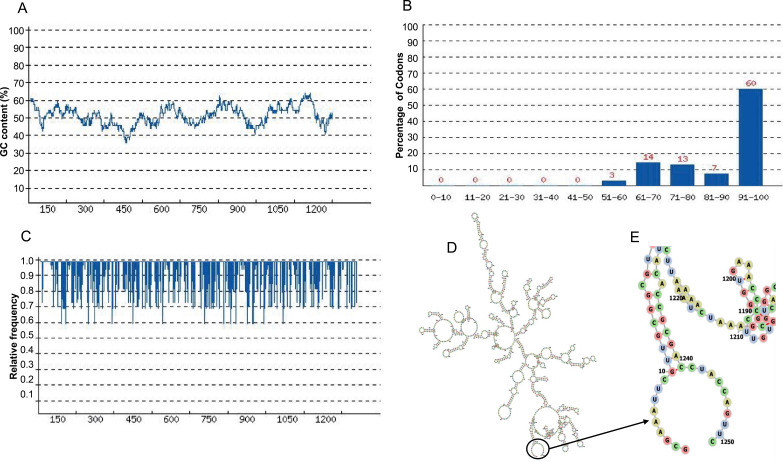
Figure 8. Codon optimization and mRNA structure of CoV-RMEN gene for expression in E. coli.
(A) GC curve (average GC content: 50.26%) of the optimized CoV-RMEN gene, (B) percentage distribution of codons in computed codon quality groups, (C) relative distribution of codon usage frequency along the gene sequence to be expressed in E. coli, and codon adaptation index (CAI) was found to be 0.87 for the desired gene, (D) secondary structure and stability of corresponding mRNA, and (E) resolved view of the start region in the mRNA structure of CoV-RMEN.

