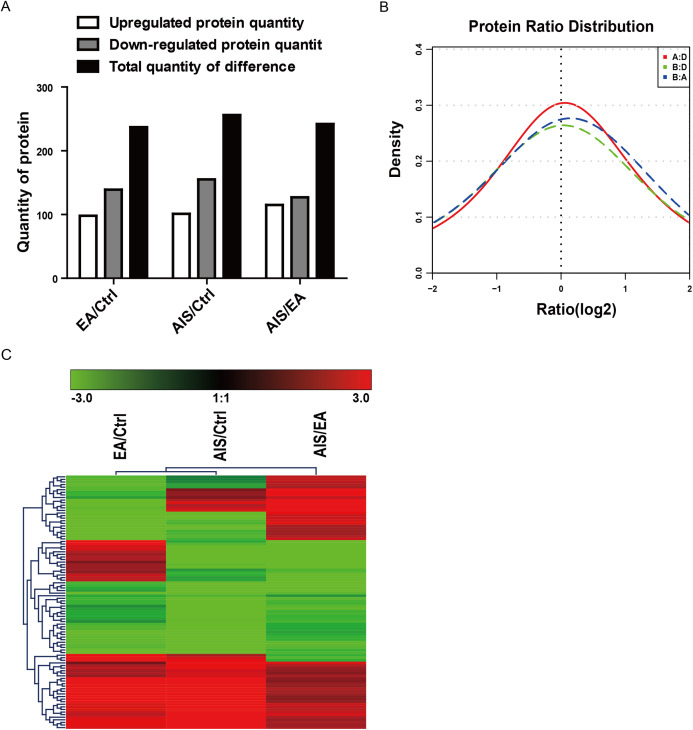
Figure 2. Distribution and stratification of differential proteins.
(A) Distribution of differential proteins between two groups. (B) Protein abundance distribution map. The figure shows the distribution of the differential multiples of all quantifiable proteins, where the x-coordinate represents the value of the differential multiples after logarithmic transformation in base 2. The part greater than 0 indicates the up-regulated expression, while the part less than 0 indicates the down-regulated expression. (C) Hierarchical clustering heat map of differential protein layers. Rows represent protein clustering and the column represents the sample pair clustering situation. As the protein ratio changes from small to large, the heat map color shows a corresponding green-black-red change.

