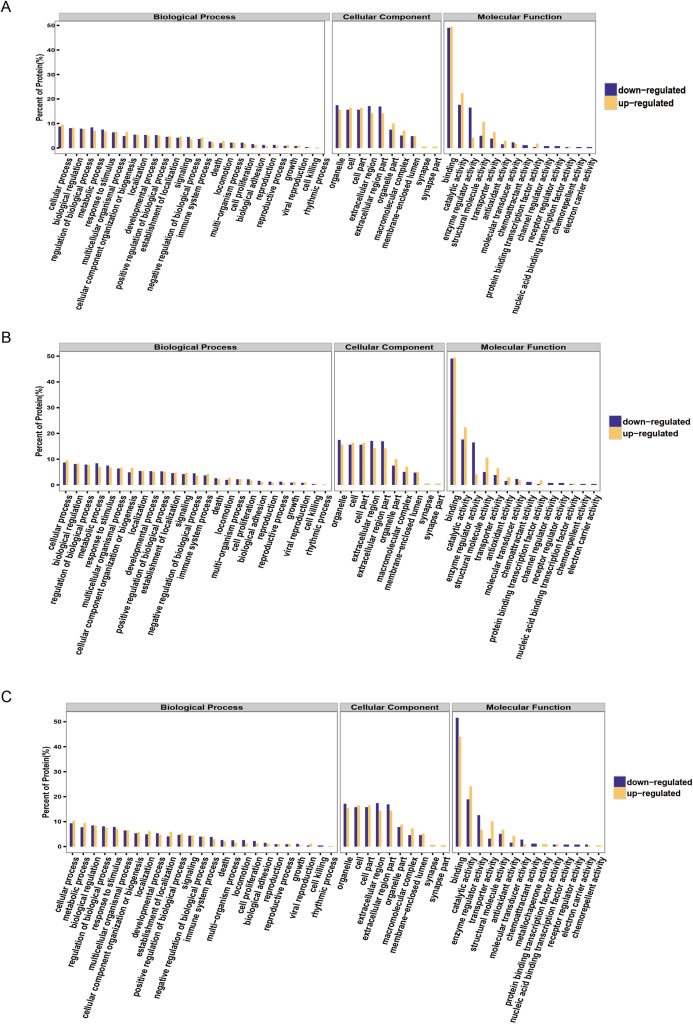
Figure 4. GO function annotation statistics results of differential proteins.
The yellow column shows that (A) EA/Ctrl (B) AIS/EA (C) AIS/Ctrl upregulation of the functional classification proportion of differential proteins under three standard bodies. The green column is the functional classification proportion under the three ontologies of down-regulated differential proteins.

