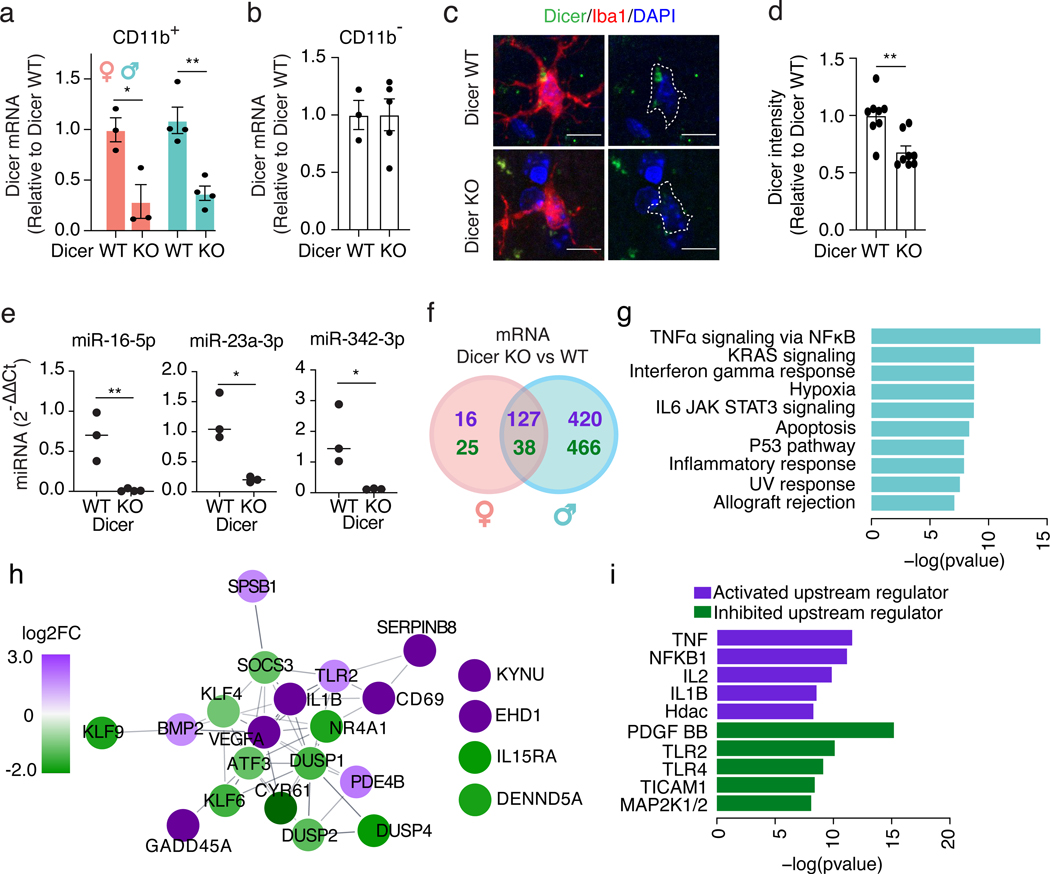
Figure 2. Loss of mature microRNAs affects microglia in a sex-dependent manner.
(a,b) qPCR of Dicer mRNA in CD11b+ (a) and CD11b– (b) cells isolated from female and male 9-month-old Dicer WT and KO mice. Error bars represent SEM. Bar denotes mean. Each dot represents one mouse. n = 3 biologically independent animals/genotype for females, 4 for males (a). n = 3 biologically independent animals for Dicer WT, 5 for Dicer KO (b). * t = 3.464, df = 4, P = 0.025, ** t = 4.855, df = 6, P = 0.0028, unpaired, two-tailed t test.
(c) Representative images from 9-month-old Dicer WT and KO mice. Iba1+ cells outlined in white. Image acquired and analysis repeated for every mouse quantified in (d). Scale bar, 10 μm.
(d) Relative fluorescence intensity of cortical Dicer immunostaining. Error bars represent SEM. Bar denotes mean. Each dot represents one mouse. n = 8 biologically independent animals/genotype, ~40 cells/genotype. ** t = 3.740, df = 14, P = 0.0022, unpaired, two-tailed t test.
(e) qPCR of miRNAs in CD11b+ cells isolated from 9-month-old Dicer WT and KO mice. Each dot represents one mouse. Bar denotes mean. n = 3 biologically independent samples/genotype, 2 animals/sample. ** t = 4.597, df = 4, P = 0.0059 (miR-16–5p), * t = 4.328, df = 4, P = 0.0124 (miR-23a-3p), * t = 2.961, df = 4, P = 0.0415 (miR-342–3p), unpaired, two-tailed t test.
(f) Venn diagram of DE mRNAs comparing microglia isolated from Dicer WT and KO females and males. Purple, genes up-regulated in Dicer KO; green, genes down-regulated in Dicer KO. n = 3 Dicer WT female samples, 2 Dicer KO female samples, 5 Dicer WT male samples, 4 Dicer KO male samples with 2 mice/sample. Full list of DEGs in Supplementary Tables 3,4.
(g) Pathway analysis with GSEA Hallmark gene set on DE genes uniquely changed in male Dicer KO compared to Dicer WT microglia identified in (f). Significance calculated by a phenotypic-based permutation test, P ≤ 0.05 by Benjamini-Hochberg correction.
(h) STRING network analysis of genes overlapping with the “TNFɑ signaling via NFκB” pathway identified in (g). Purple, log2FC ≥ 1; green, log2FC ≤ −1.
(i) Ingenuity Pathway Analysis for predicted upstream regulators of genes overlapping with the “TNFɑ signaling via NFκB” pathway identified in (g). One-sided Fisher’s exact test based on a Hypergeometric distribution.

