Figure 3.

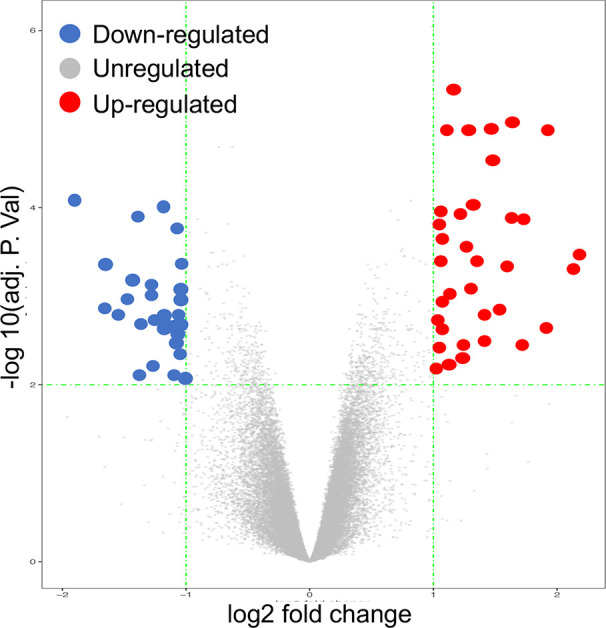
Volcano Plot image displaying the 66 genes that were significantly up-regulated or down-regulated (P-value < 0.05) in OA cartilage, compared to normal controls.

Volcano Plot image displaying the 66 genes that were significantly up-regulated or down-regulated (P-value < 0.05) in OA cartilage, compared to normal controls.