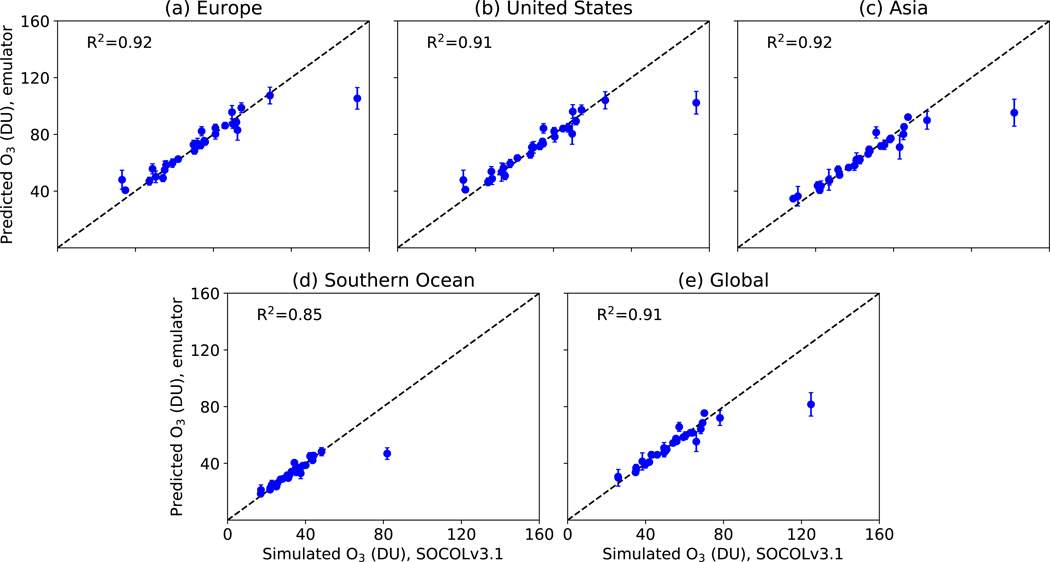
Figure 3.
Tropospheric column ozone as predicted by the GP emulator, vs. the amount simulated in SOCOLv3.1 “test” simulations (i.e., the simulations used to validate the emulator). The errorbars indicate the uncertainty (mean ± standard deviation) on the GP emulator output, and the 1:1 line and coefficient of determination (R2 value) are also shown. These simulations correspond to running the GP emulator and the simulator (SOCOLv3.1) at each of the 27 validation inputs, for: (a) Europe (37–60° N, 0–42° E); (b) United States (32–52° N, 67–124° W); (c) Asia (6–49° N, 70–146° E), (d) the Southern Ocean (45–60° S, all longitudes); and (e) globally.

