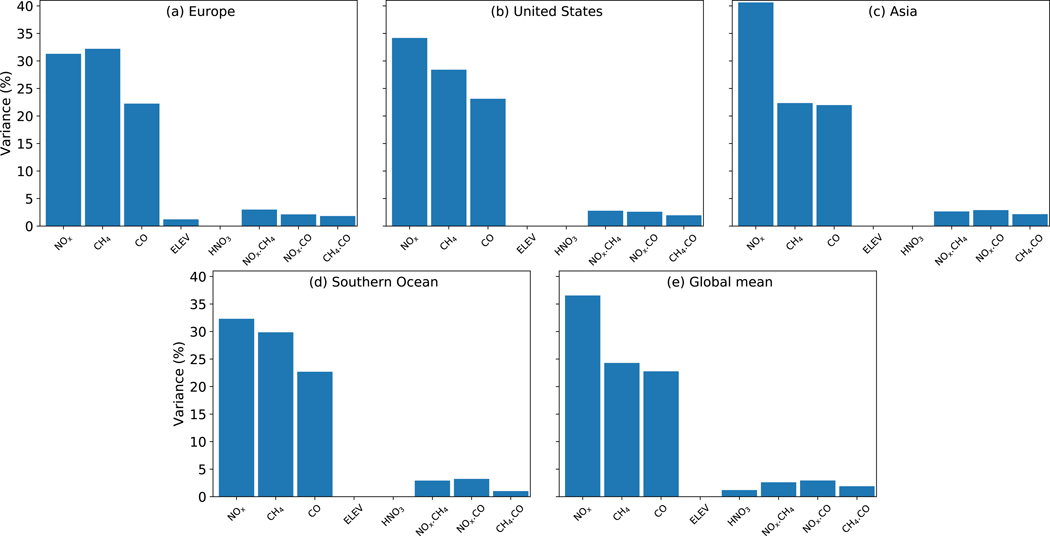
Figure 5.
Contributions to variance from the sensitivity forcings/parametrizations applied (Table 1), for the same regions shown in Figure 3. For clarity only those which contribute at least 1% to the variance are shown. NOx = NOx emissions; CH4 = CH4 concentrations; CO = CO+NMVOC emissions; ELEV = the number of vertical model levels that NOx, CO and NMVOC emissions are prescribed on. HNO3 the rate of HNO3 washout. Joint interactions, indicated by e.g. NOx.CH4 are also indicated where these contribute at least 1% to the variance.

