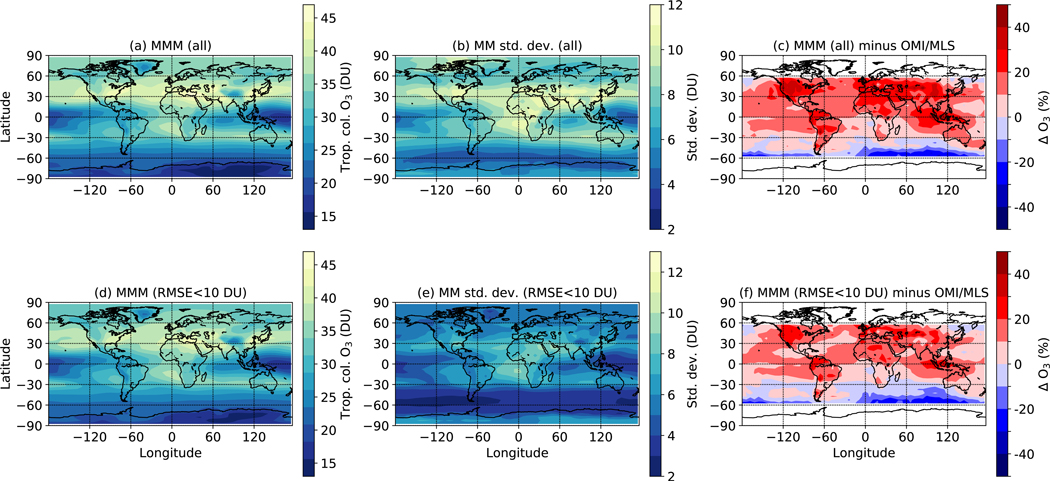
Figure 8.
Annual-mean year 2005 tropospheric column ozone. (a) The multi-model mean (MMM) of all CCMI models; (b) multi-model standard deviation for the models shown in (a); (c) percent difference between the MMM in (a) and OMI/MLS (MMM minus OMI/MLS); (d) MMM for a subset of CCMI models – those with a root-mean-square error (RMSE) less than 10 DU when compared with OMI (see Fig. 7); (e) multi-model standard deviation for the models shown in (d); (f) percent difference between the MMM in (d) and OMI/MLS (MMM minus OMI/MLS).

