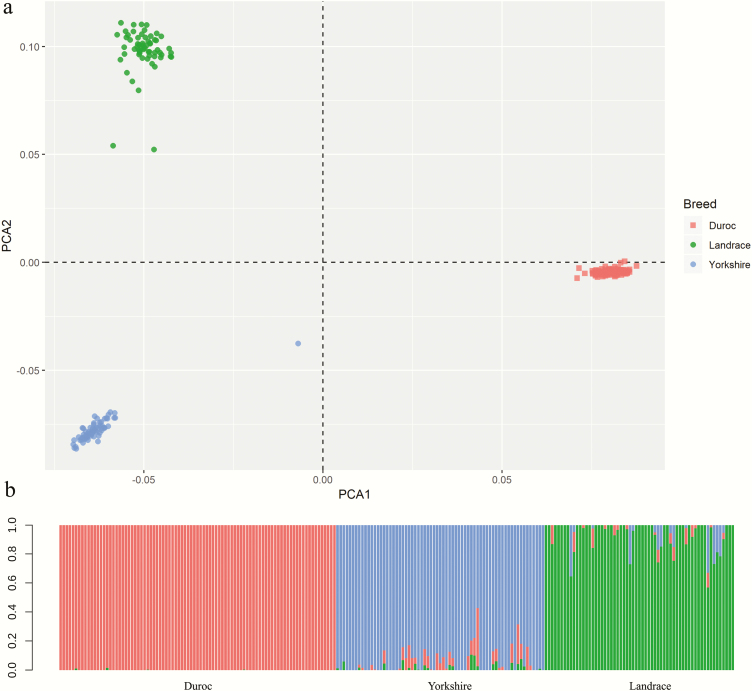
Figure 3.
PCA plot and ADMIXTURE analysis to show the genetic relationship between three pig breeds (all 217 animals). (a) PCA plot of three breeds, indicating genetic variation along the first two eigenvectors. The dots indicate DD (salmon), YY (blue), and LL (green). (b) Population assignment proportions per individual based on results from ADMIXTURE analysis (K = 3). In the plot, each vertical bar represents a single individual and the different colors reflect the genetic contribution from each of the three components.

