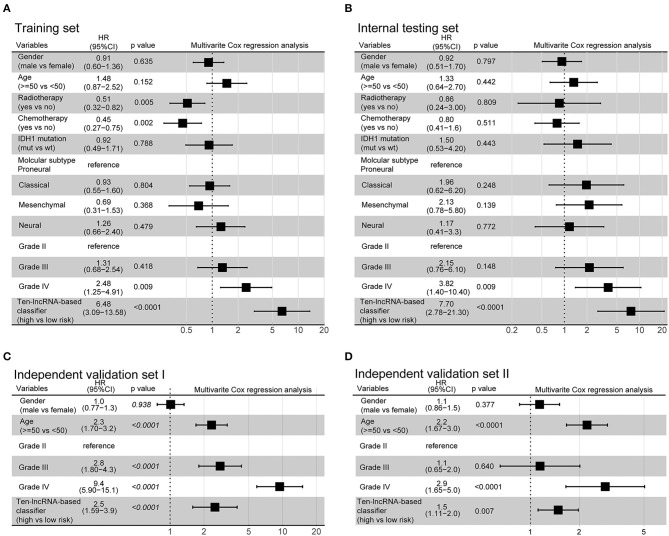
Figure 3.
Multivariate analysis based on the 10-lncRNA-based classifier and clinical risk factors in the training, internal testing, and two independent validation sets. (A) Training set. (B) Internal testing set. (C) Independent validation set I. (D) Independent validation set II. Solid and black squares represent the HR of death. Close-ended horizontal lines represent 95% CI. We calculated p-values using Cox regression hazard analysis.

