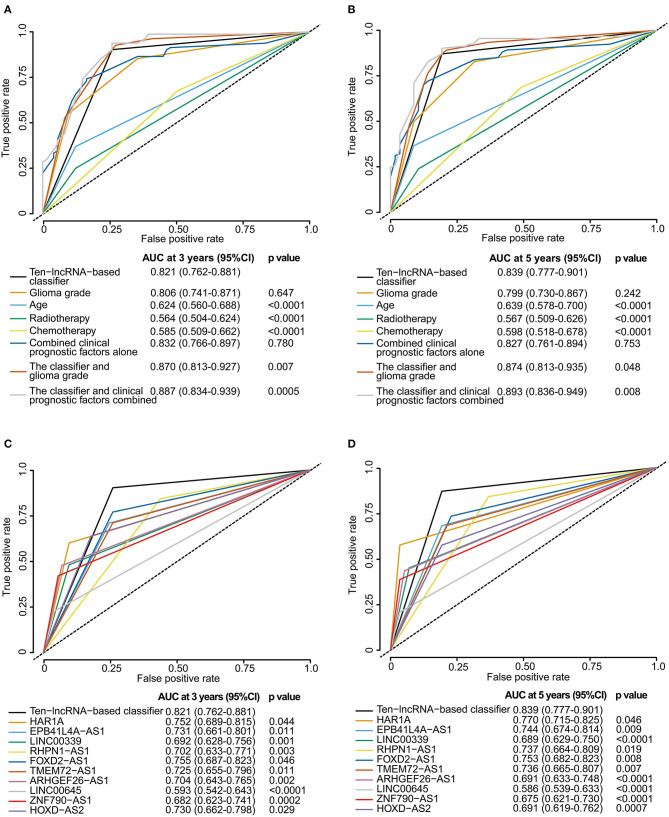
Figure 5.
Time-dependent ROC curves comparing the prognostic accuracy of the 10-lncRNA-based classifier with those of clinicopathological risk factors and single lncRNAs in the training set. (A,B) Comparisons of prognostic accuracy by the 10-lncRNA-based classifier (high risk vs. low risk), glioma grade, age (age >= 50 vs. age <50), radiotherapy (with vs. without radiotherapy), chemotherapy (with vs. without chemotherapy), combined clinical prognostic factors alone, the classifier and glioma grade combined, or the classifier and clinical prognostic factors combined. (C,D) Comparisons of the prognostic accuracy by the 10-lncRNA-based classifier (high risk vs. low risk), HAR1A (high vs. low expression), EPB41L4A-AS1 (high vs. low expression), LINC00339 (high vs. low expression), RHPN1-AS1 (high vs. low expression), FOXD2-AS1 (high vs. low expression), TMEM72-AS1 (high vs. low expression), ARHGEF26-AS1 (high vs. low expression), LINC00645 (high vs. low expression), ZNF790-AS1 (high vs. low expression), or HOXD-AS2 (high vs. low expression). The optimum cut-off points for the 10-lncRNAs were generated using X-tile plots. (A,C) AUC at 3 years. (B,D) AUC at 5 years. The p-value shows the AUC at 3 or 5 years for the 10-lncRNA-based classifier vs. the AUC at 3 or 5 years for other features.

