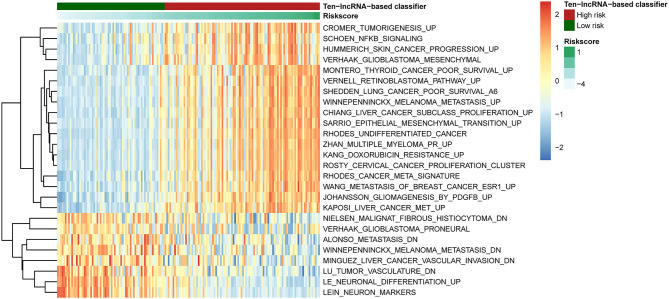
Figure 7.
Pathway profile across the training set. Rows represents biological pathways, and columns represent patients with glioma. Each grid represents a score of pathway activity calculated by GSVA. The upper horizontal bar marked the information related to patients, including the risk scores and risk groups.

