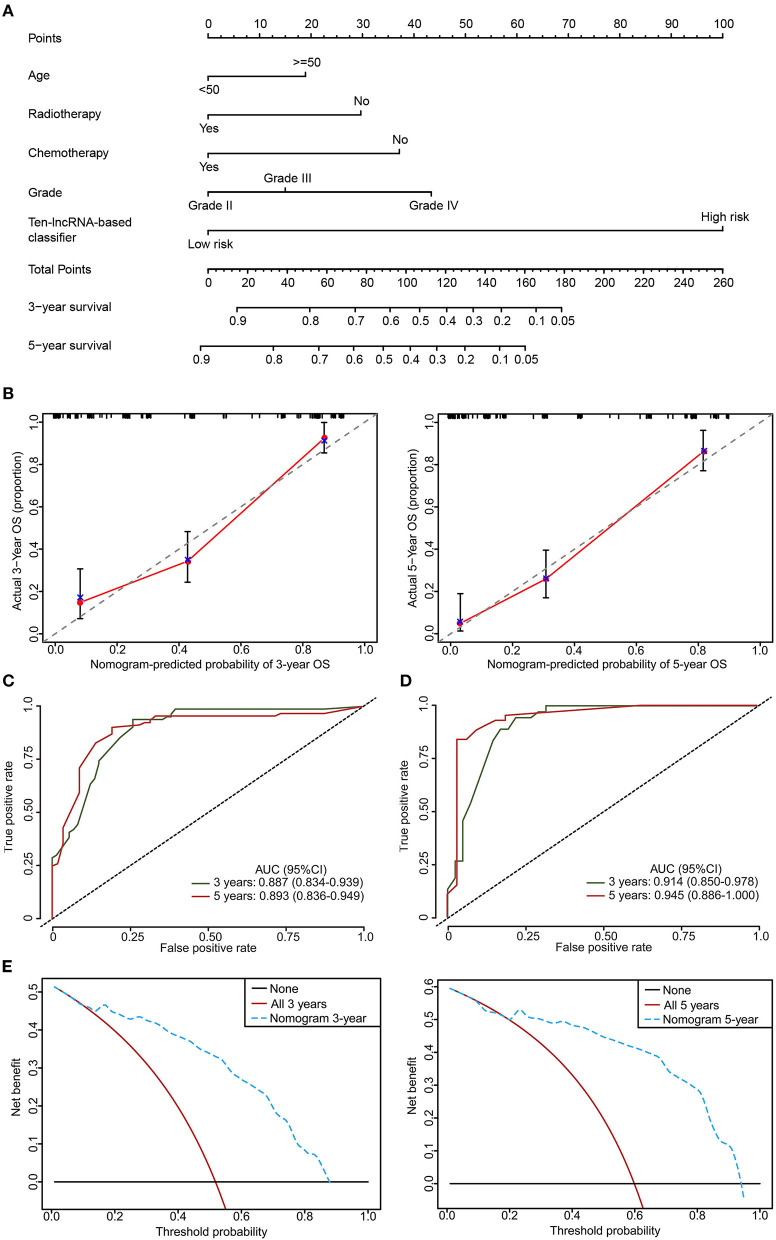
Figure 8.
The developed nomogram to predict 3 and 5 year OS probability in glioma. (A) The nomogram was constructed in the training set, with the 10-lncRNA-based classifier, age, radiotherapy, chemotherapy, and glioma grade incorporated. (B) Calibration curve of the model in terms of agreement between predicted and observed 3 and 5 year outcomes in the training set. Close-ended vertical lines represent 95% CI. The x-axis indicates predicted OS probability, and the y-axis indicates the actual OS. The 45-degree line represents perfect prediction. (C,D) Time-dependent ROC curves based on the nomogram for 3 and 5 year OS probability in the training set and the internal testing set. Not all of the clinical factors constituting the nomogram could be obtained in Independent validation sets I and II. (E) Decision curve analysis (DCA) for assessment of the clinical utility of the nomogram. The x-axis indicates the percentage of threshold probability, and the y-axis represents the net benefit.

