
Figure 6:
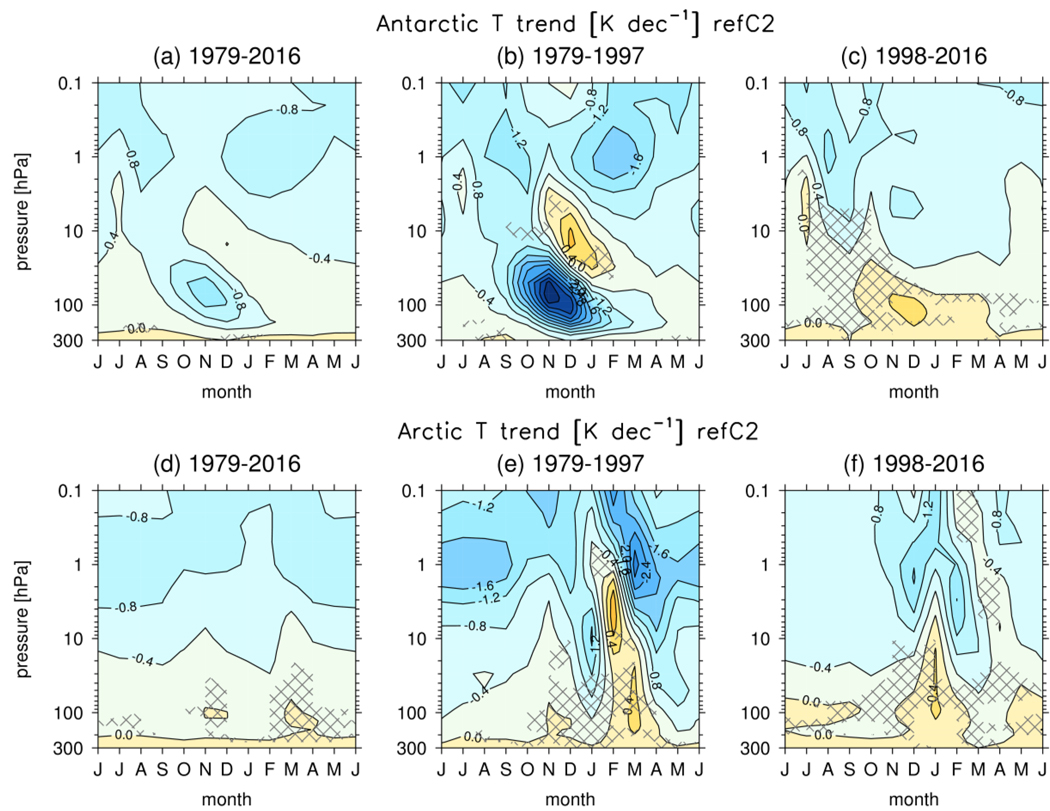
CCMI multi-model mean polar temperature trends [K decade−1] as a function of month for the periods (a,d) 1979–2016, (b,e) 1979–1997 and (c,f) 1998–2016. (a-c) shows the Antarctic (70–90°S) and (d-f) shows the Arctic (70–90°N). The contour interval is 0.4 K decade−1. The hatching shows where less than 10 out 14 models agree on the sign of the trend.