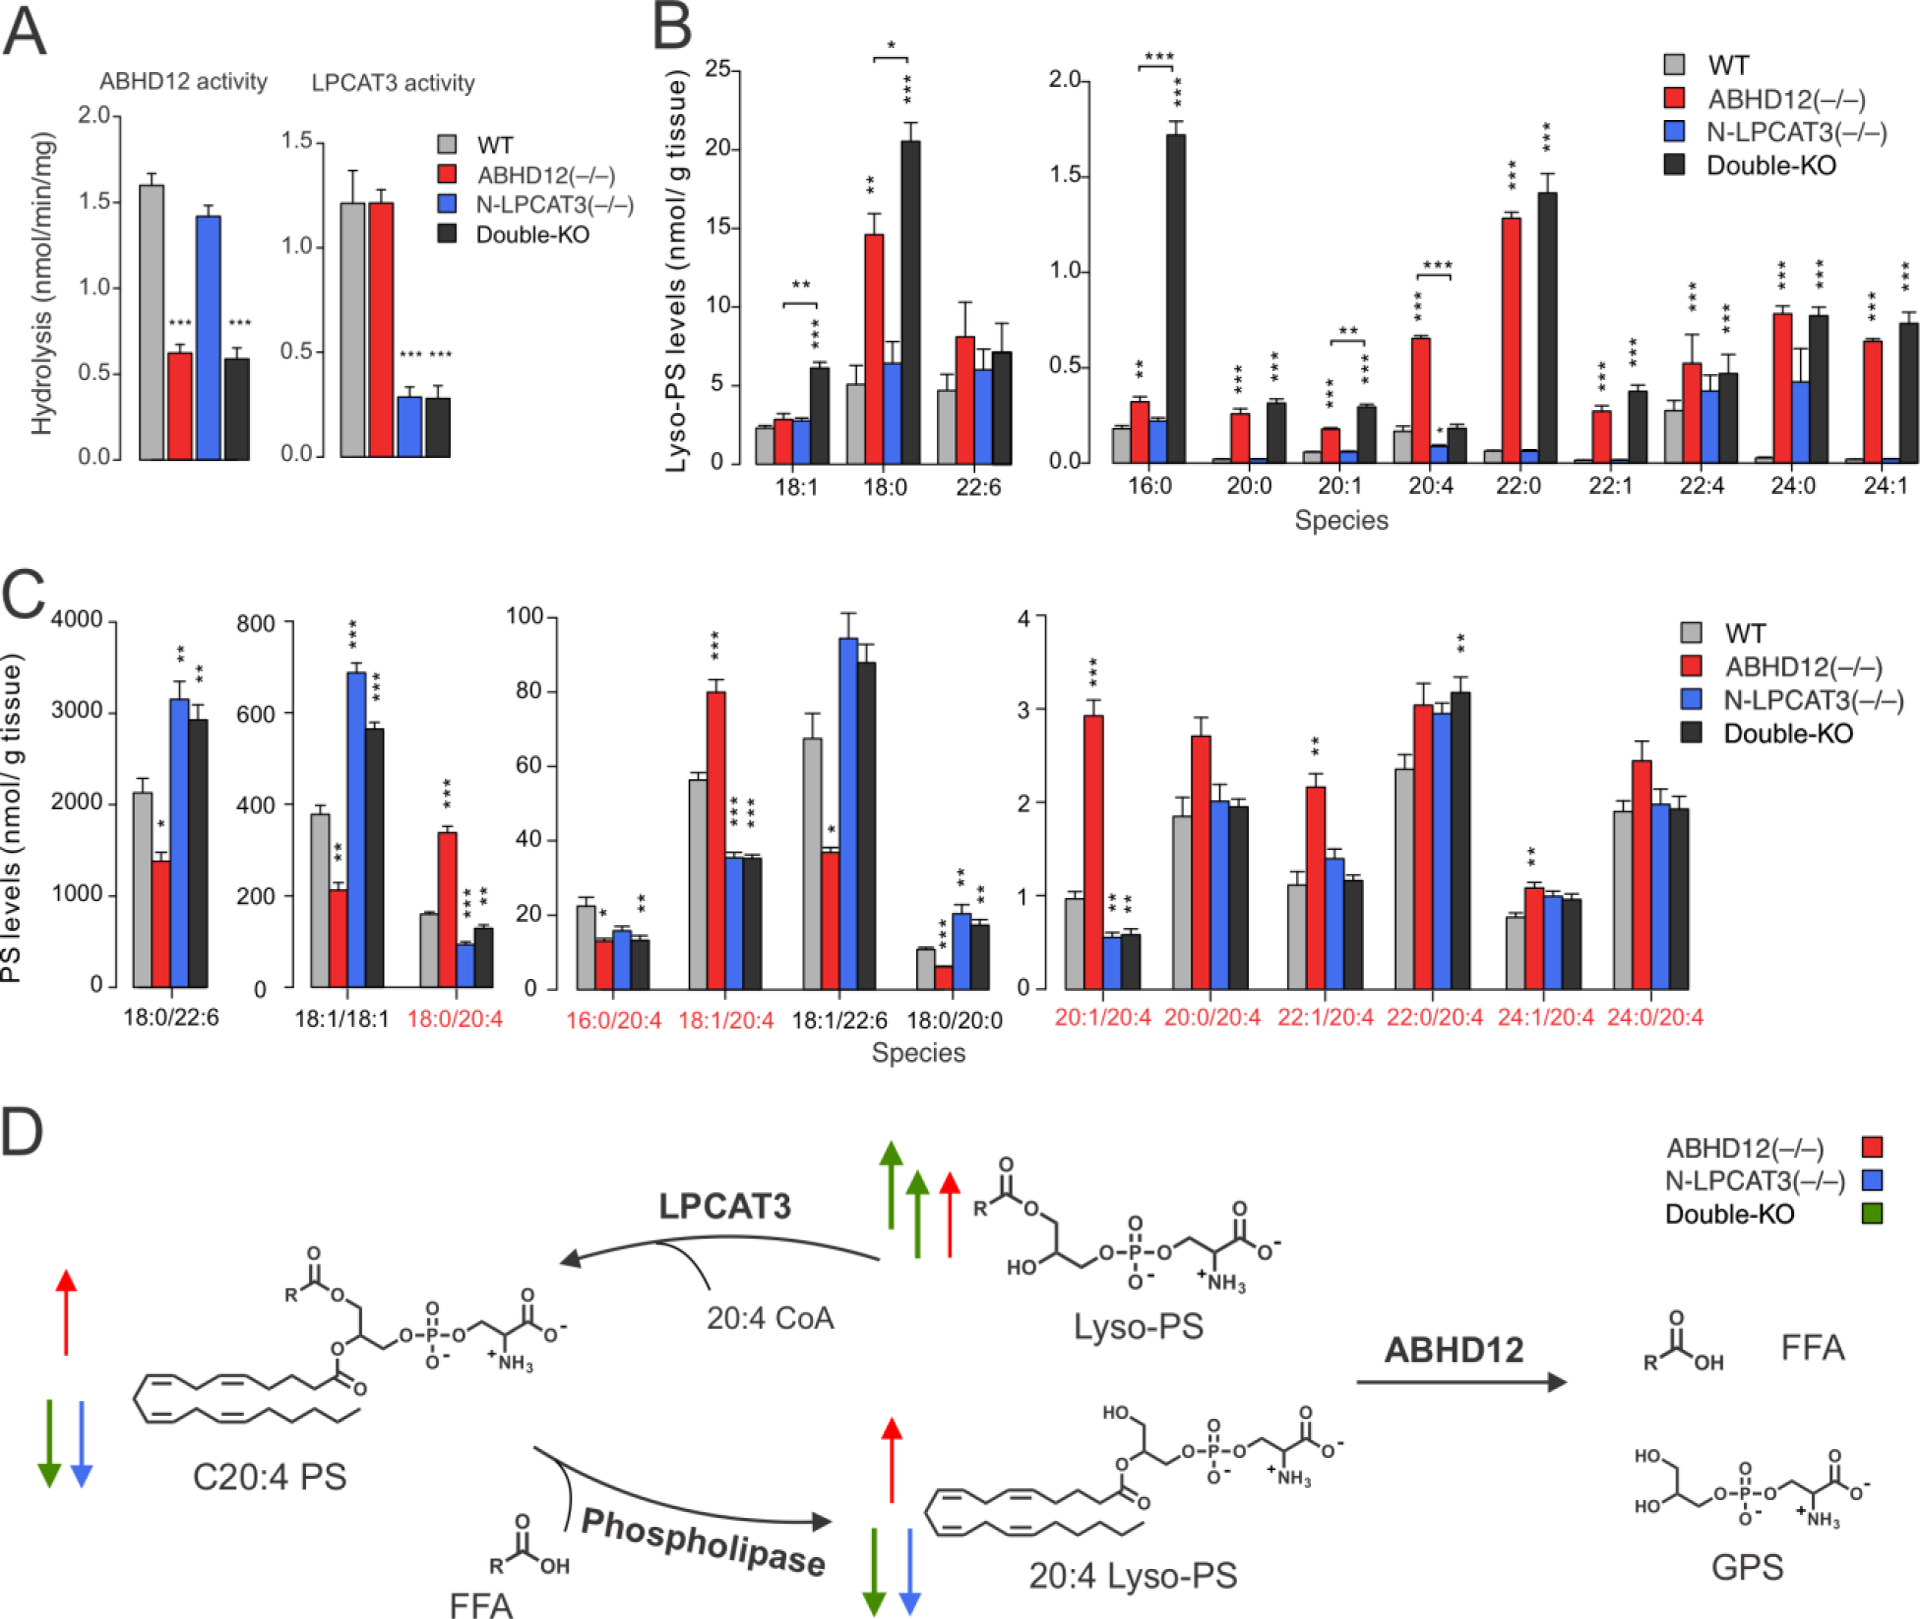
Figure 3.

Lyso-PS and PS lipid profiles of ABHD12(–/–), N-LPCAT3(–/–), and ABHD12/N-LPCAT3 double-KO mice. A) Lyso-PS hydrolysis (ABHD12) and lyso-PS acyltransferase (LPCAT3) activities from brain membrane lysates (0.05 mg/mL) of WT (LPCAT3(fl/fl)), ABHD12(–/–), N-LPCAT3(–/–), and double-KO mice. B, C) Brain lyso-PS (B) and PS (C) lipid profiles of WT, ABHD12(–/–), N-LPCAT3(–/–), and double-KO mice. Data represent mean ± SE values and are shown for eleven week-old mice. n = 5/group. Similar profiles were observed in nine month-old mice (Table S1). D) Metabolic pathway diagram delineating the coordinated regulation of lyso-PS and C20:4 PS content in the mammalian brain by ABHD12 and LPCAT3. Arrows indicate abundance changes of indicated metabolites in ABHD12(–/–) (red), N-LPCAT3(–/–) (blue), and double-KO (green) mice. *P < 0.05; **P < 0.01; ***P < 0.001 (two-sided Student’s t-test performed relative to WT.
