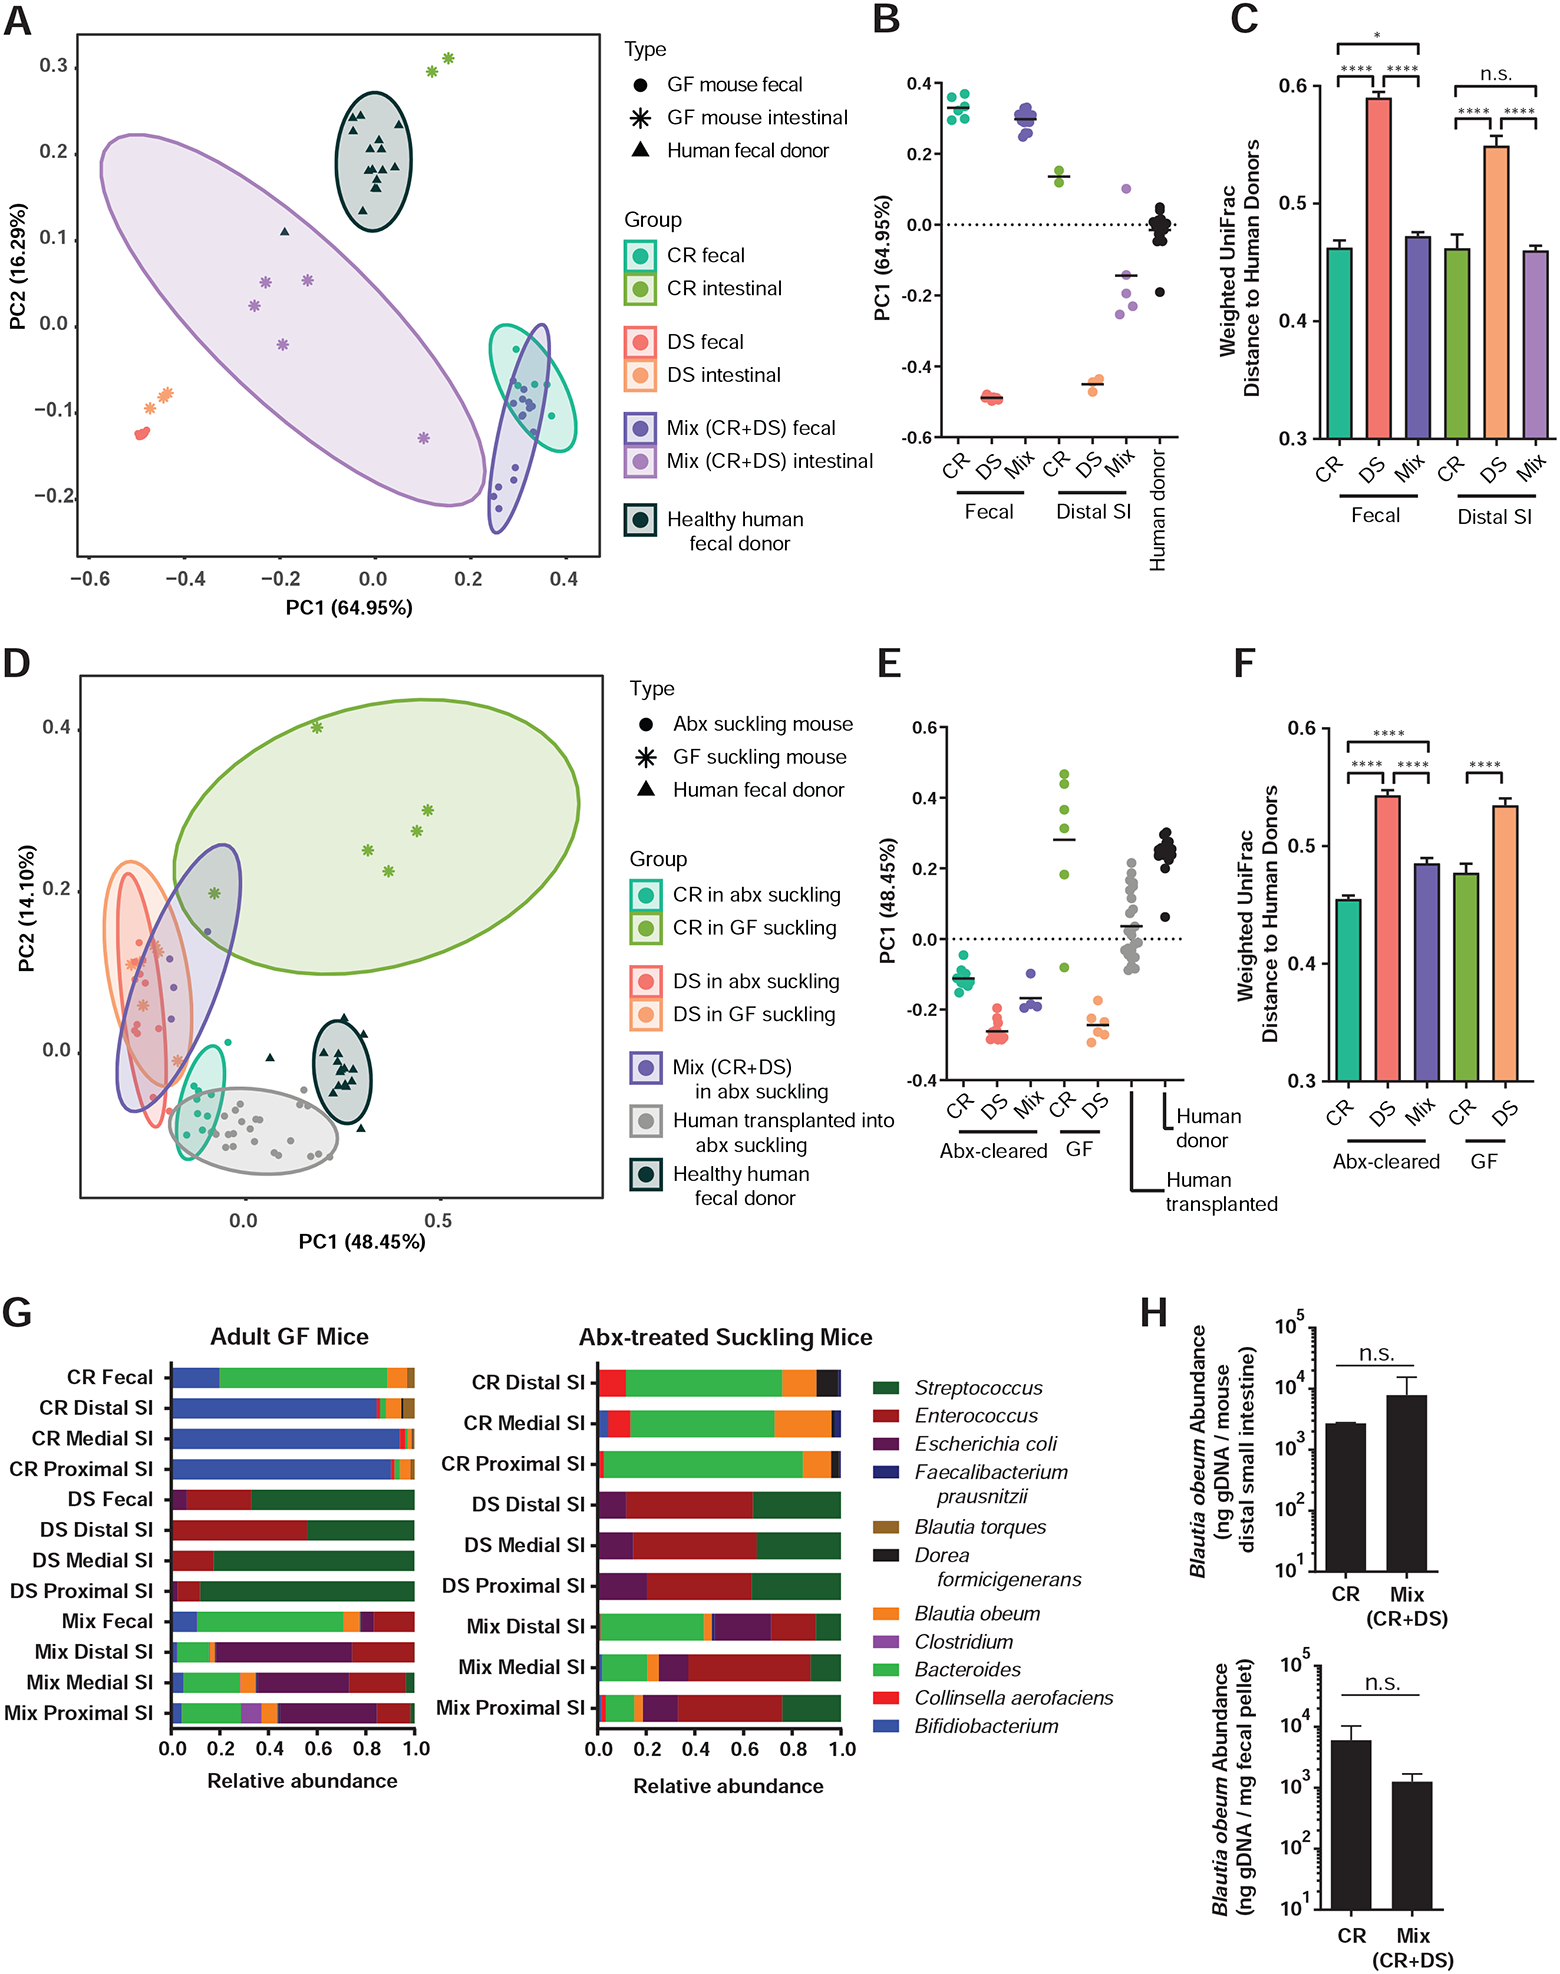
Figure 3. Addition of the CR model human microbiome to mice hosting DS microbes yields a community structure closer to complete fecal communities of healthy human volunteers.

(A, D) Principal coordinates analysis (PCoA) of microbial community diversity based on weighted UniFrac distance, % variance explained shown in parentheses for each axis. Ellipses show 95% confidence intervals. (A) PCoA of fecal samples and distal third of small intestine of GF mice with model communities during V. cholerae infection compared to healthy US donor fecal samples, with (B) PC1 positions and (C) all pairwise weighted UniFrac distances to healthy US donor fecal samples. (D) PCoA of model communities and healthy human donor communities in suckling mice, with (E) PC1 positions and (F) all pairwise weighted UniFrac distances to healthy US donor fecal samples. (G) Microbiome structure during infection with V. cholerae and host reads filtered (left) and in antibiotic-treated suckling mice without V. cholerae (right). (H) B. obeum abundance in adult GF mice containing indicated microbiomes during V. cholerae infection (4d post infection). * P<0.05, **** P<0.0001; n.s. not significant (Mann-Whitney U-test). Error bars represent mean ± SEM.
