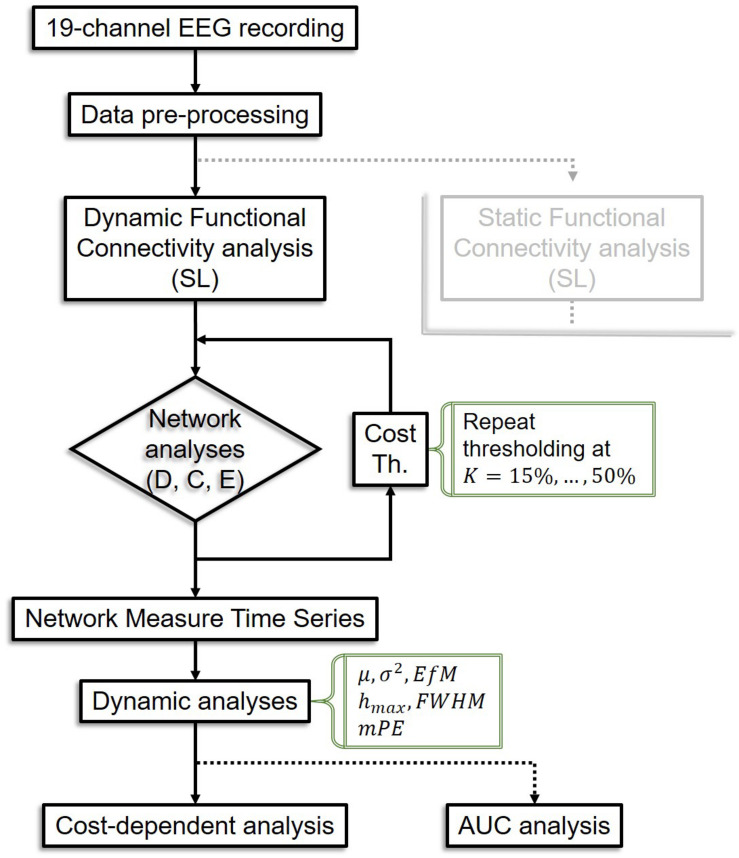
FIGURE 2.
Flowchart of the analysis pipeline. The analysis pipeline for static connectivity analysis is not shown as it is equivalent in most steps to the dynamic pipeline, except that only one connectivity matrix is acquired per subject, leading to only one value for each network measure instead of a time series, thus dynamic analyses are bypassed. SL, synchronization likelihood; D, connectivity strength; C, clustering coefficient; E, global efficiency; Th, thresholding; K, cost; AUC, area under the curve.

