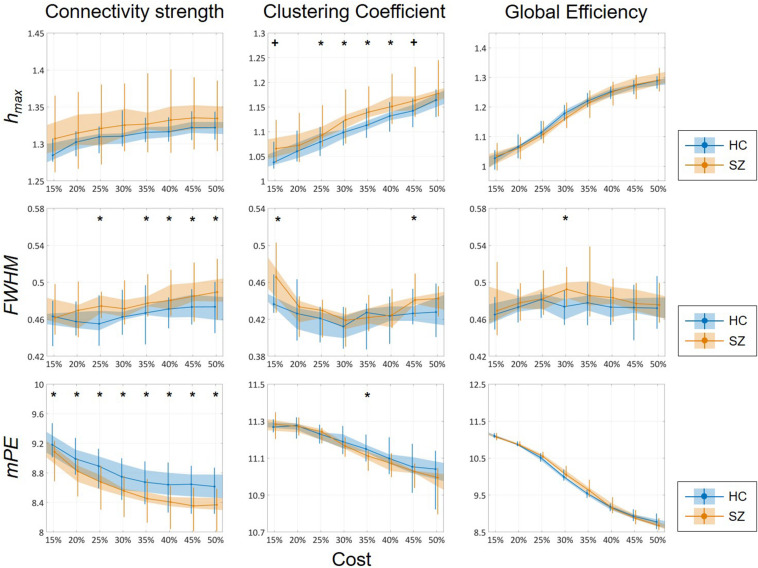
FIGURE 6.
Cost-dependent results of multifractal and entropy analysis of network measures. Multifractal measures (hmax and FWHM) and modified permutation entropy (mPE) of all three network measures are plotted as functions of the cost. Black markers indicate significant group level difference (p < 0.05, corrected). *Two-sample t-test; +Mann–Whitney U-test; HC, healthy control; SZ, schizophrenia.

