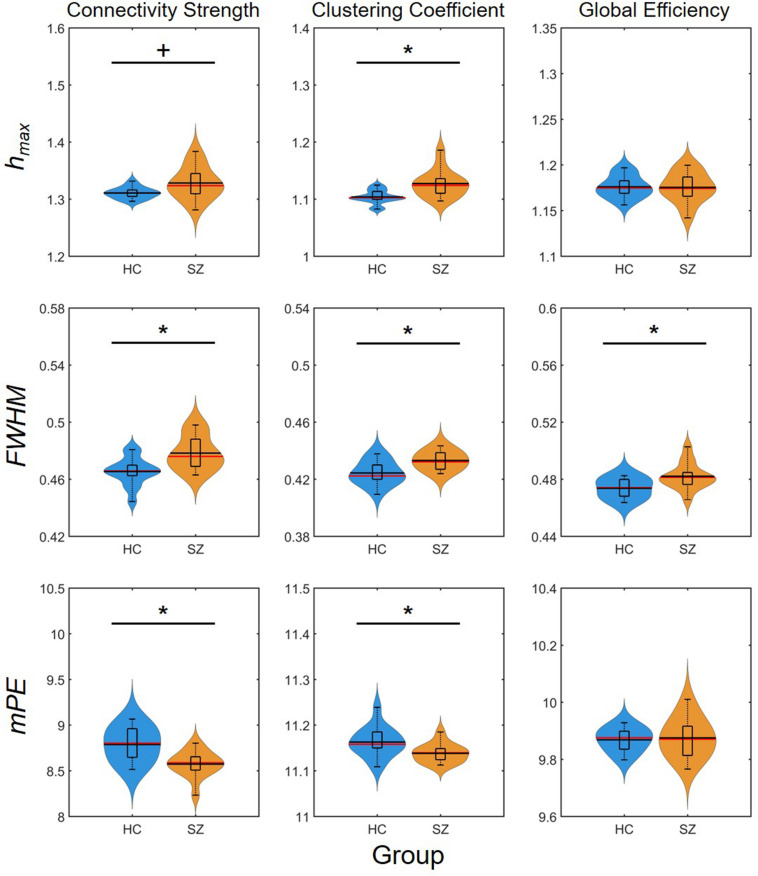
FIGURE 7.
Results of the area-under-the-curve analysis regarding multifractal and entropy-related properties of dynamic network measures. Black markers indicate significant group level difference (p < 0.05). *Two-sample t-test; +Mann–Whitney U-test; HC, healthy control; SZ, schizophrenia; hmax, Hölder exponent at the peak of the multifractal spectrum; FWHM, full width at half maximum; mPE, modified permutation entropy.

