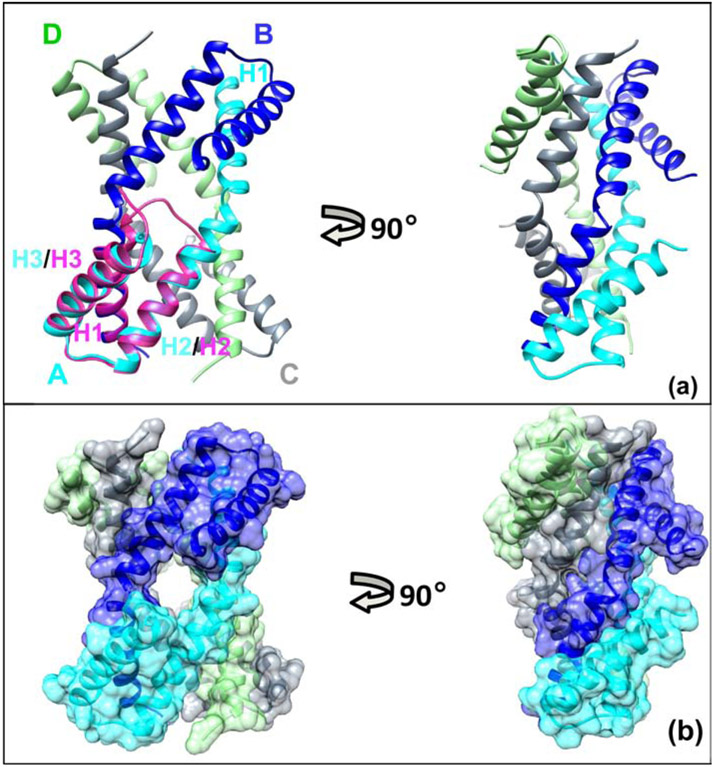
Figure 1. Crystal structure of sRI (PDB = 6PSH).
A Ribbon diagram of tetramer observed in the crystal of the free sRI, colored by subunit: blue - subunit A, cyan - subunit B, gray - subunit C, and light green - subunit D. H1–3 helices are marked for the subunit A in corresponding color.
The domain swapped conformation of RI when bound to sT is illustrated in the overlay of sT-bound sRI (magenta) with subunit A of free sRI, H1 −3 helices are labeled for this form in magenta.
B Two views of the surface representation of the sRI tetramer, colored by subunit same as on the panel A illustrate extensive contacts among subunits.

