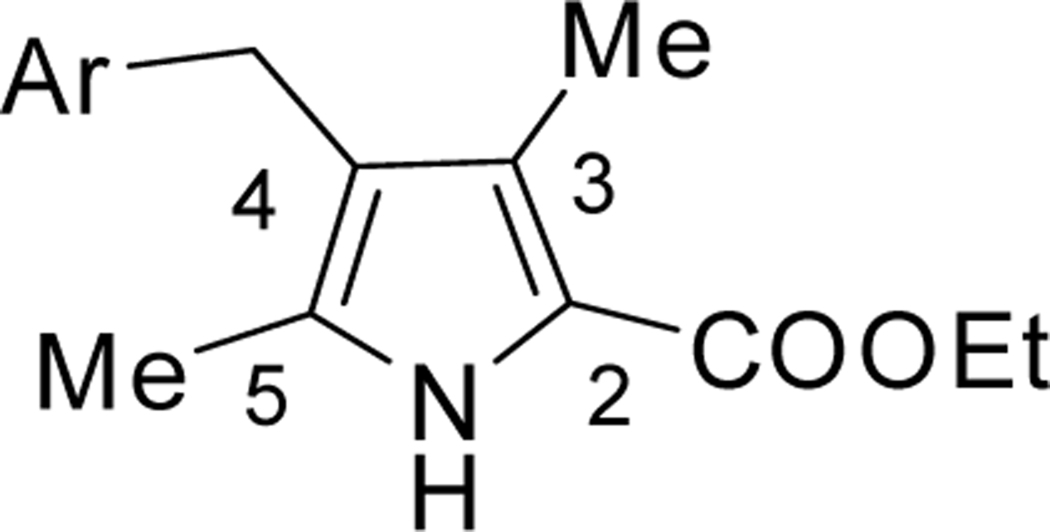
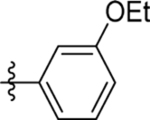
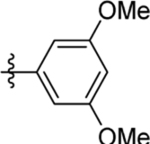
Table 1:
 | ||||||
|---|---|---|---|---|---|---|
| Cmpd | Cmpd ID | Ar | IC50 (μM) | EC50 (μM) | ||
| PfDHODH | PvDHODH | hDHODH | Pf3D7 cellsa | |||
| 1 | DSM265 | NA | 0.030 ±0.014 (12) | 0.072±0.028 (11) | >100 (4) | 0.0060 ± 0.0019 (9) |
| 2 | Genz-667348 * | NA | 0.022 | 0.042 | >30 | 0.007 |
| 3 | DSM43 |  |
0.27 ±0.092 (3) | 0.045 (0.04 – 0.050) | >100 (2) | 0.23, 0.25 |
| 4 | DSM483 |  |
0.10±0.033 (3) | 0.014 (0.013–0.016) | >100 | 0.061, 0.071 |
| 5 | DSM484 |  |
0.83 (0.74–0.92) | 0.021 (0.018–0.025) | >100 | 0.53 (0.28–0.78) |
| 6 | DSM485 |  |
0.52 (0.46–0.60) | 0.055 (0.036–0.084) | >100 | 0.59 (0.47–0.75) |
| 7 | DSM486 |  |
2.3 (2.0–2.7) | 0.47±0.065 (3) | >100 | 10 (6.7 – 15) |
| 8 | DSM487 |  |
0.57 (0.46–0.71) | 0.040 (0.03–0.054) | >100 | 0.47 (0.2–1.1) |
| 9 | DSM491 |  |
0.018 (0.016–0.020) | 0.0094 (0.0077–0.011) | >100 | 0.0092 (0.0076–0.011) |
| 10 | DSM520 |  |
0.3 (0.25–0.37) | 0.06 (0.05–0.072) | >100 | 0.10 (0.090–0.11) |
| 11 | DSM490** |  |
>100 | 16 (11–21) | nd | nd |
Pf, P. falciparum; Pv, P. vivax; h, human. For each experiment, triplicate data were collected at each inhibitor concentration. A 3-fold dilution series was used to determine IC50’s and either a 3-fold or 4-fold dilution series was used to determine the EC50’s. Values in parenthesis represent the 95% confidence interval. For key active compounds, multiple independent experiments were performed and for these compounds data represent mean ± standard deviation with the number of independent experiments in parenthesis. If only 2 biological replicates were collected than both values are shown.
data taken from28.
Compound has an N-methyl as shown in Scheme 1.
