
Fig. 8.
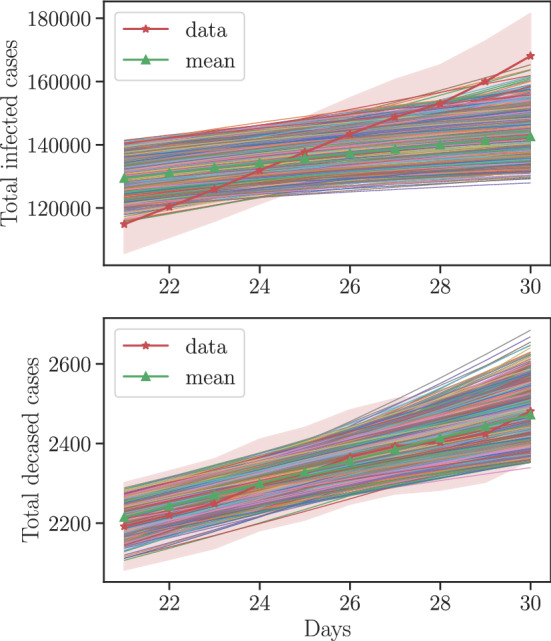
The model outputs at the validation posterior samples. The red line and the red shaded region corresponds to the data and the region within one standard deviation according the likelihood model. The green line corresponds to the model output at the mean of the validation posterior samples