
Figure 6.
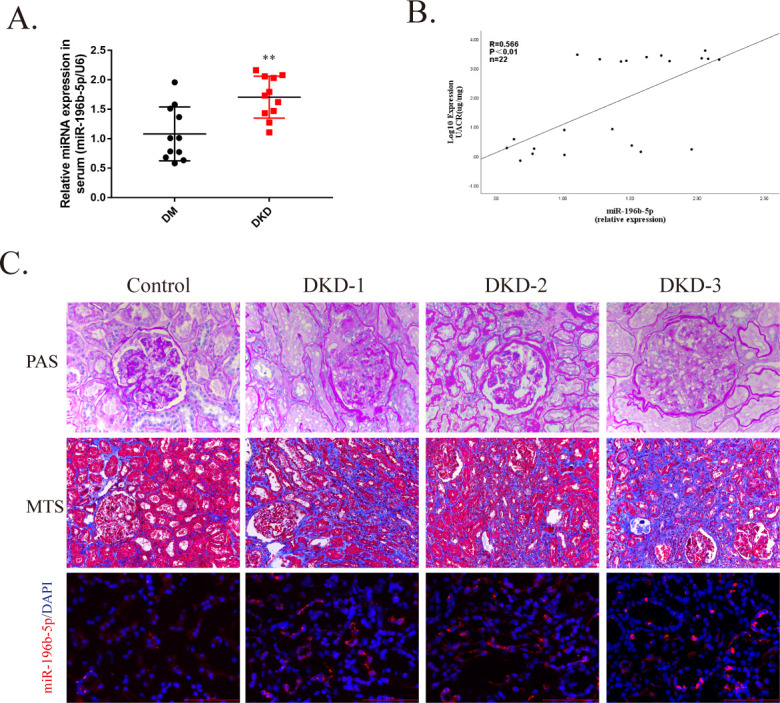
miR-196b-5p expression increased in serum and kidney of patients with diabetic kidney disease (DKD). (A) Scatter plots of serum miR-196b-5p expression level in patients with diabetes mellitus (DM) with DKD (n=11) and without DKD (n=11). Each dot represents one patient. **p<0.01vs DM. (B) Correlation analysis of serum miR-196b-5p with albumin-to-creatinine ratio (UACR). The Spearman’s correlation coefficient (R) is given. (C) Representative image of periodic acid-Schiff (PAS) staining and Masson’s trichrome staining (MTS) for interstitial injury and fibrosis detection and representative image of miR-196b-5p staining of patients with or without DKD assessed by in situ hybridization. Scale bar, 100 µm. miRNA, micro RNA.