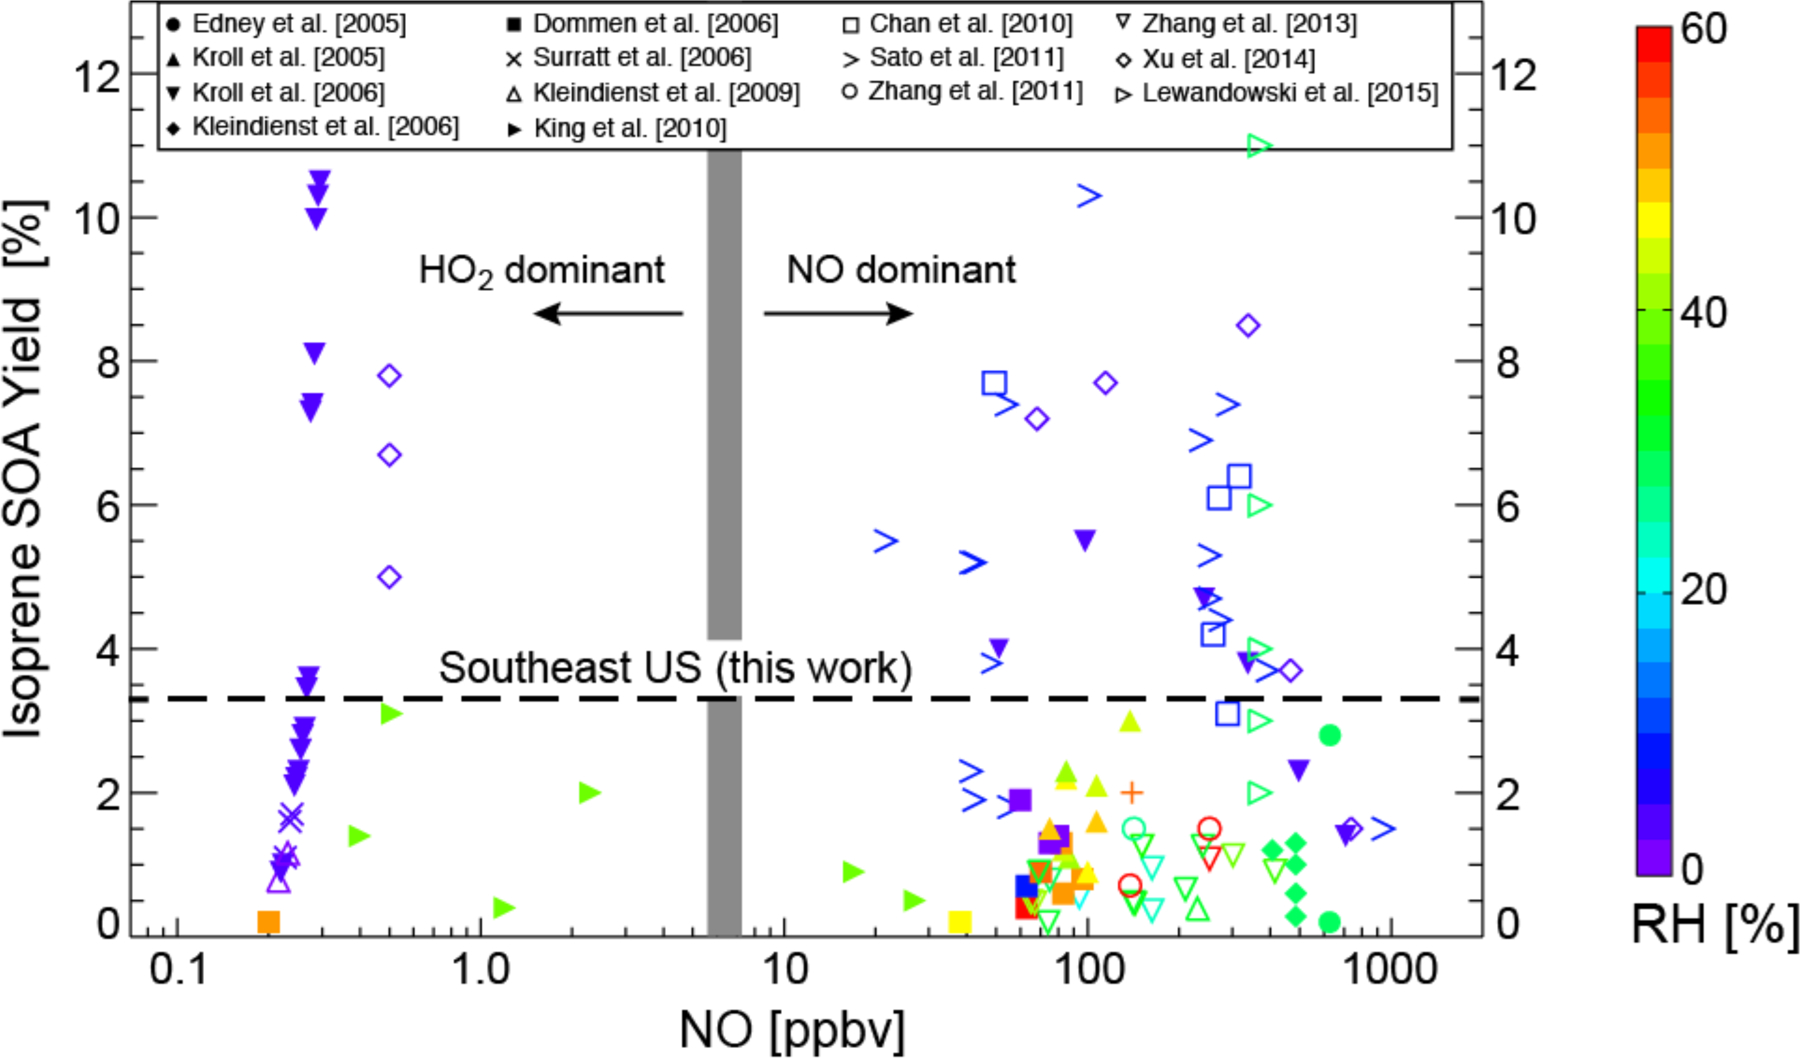
Figure 1.

Yields of secondary organic aerosol (SOA) from isoprene oxidation as reported by chamber studies in the literature and plotted as a function of the initial NO concentration and relative humidity (RH). Yields are defined as the mass of SOA produced per unit mass of isoprene oxidized. For studies with no detectable NO we plot the NO concentration as half the reported instrument detection limit, and stagger points as needed for clarity. Data are colored by relative humidity (RH). The thick grey line divides the low-NOx and high-NOx pathways as determined by the fate of the ISOPO2 radical (HO2 dominant for the low-NOx pathway, NO dominant for the high-NOx pathway). The transition between the two pathways occurs at a higher NO concentration than in the atmosphere because HO2 concentrations in the chambers are usually much higher. Also shown as dashed line is the mean atmospheric yield of 3.3% for the Southeast US determined in our study.
