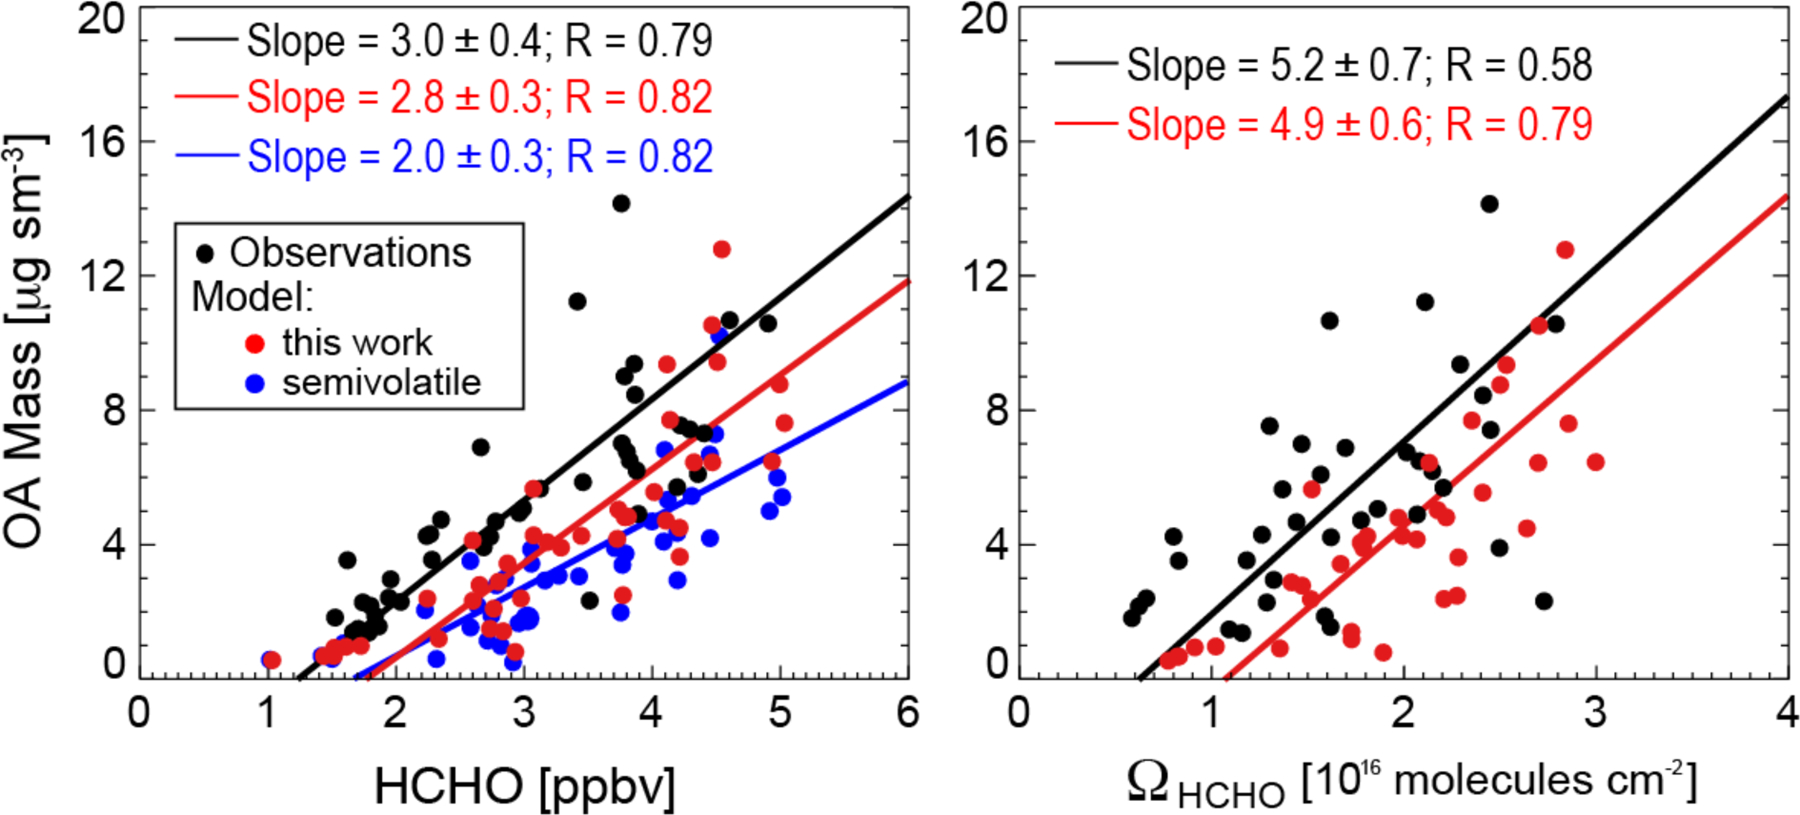
Figure 3.

Relationship of organic aerosol (OA) and formaldehyde (HCHO) concentrations over the Southeast US in summer. The figure shows scatterplots of SEAC4RS aircraft observations of OA concentrations in the boundary layer (< 2 km) vs. HCHO mixing ratios measured from the aircraft (left), and column HCHO (ΩHCHO) retrieved from OMI satellite observations (right). Individual points are data from individual SEAC4RS flight days (August 8 – September 10), averaged on the GEOS-Chem grid. OMI data are for SEAC4RS flight days and coincident with the flight tracks. GEOS-Chem is sampled for the corresponding locations and times. Results from our simulation with aqueous-phase isoprene SOA chemistry are shown in red, and results from a simulation with the Pye et al. (2010) semivolatile reversible partitioning scheme are shown in blue. Aerosol concentrations are per m3 at standard conditions of temperature and pressure (STP: 273 K; 1 atm), denoted sm−3. Reduced major axis (RMA) regressions are also shown with regression parameters and Pearson’s correlation coefficients given inset. 1σ standard deviations on the regression slopes are obtained with jackknife resampling.
