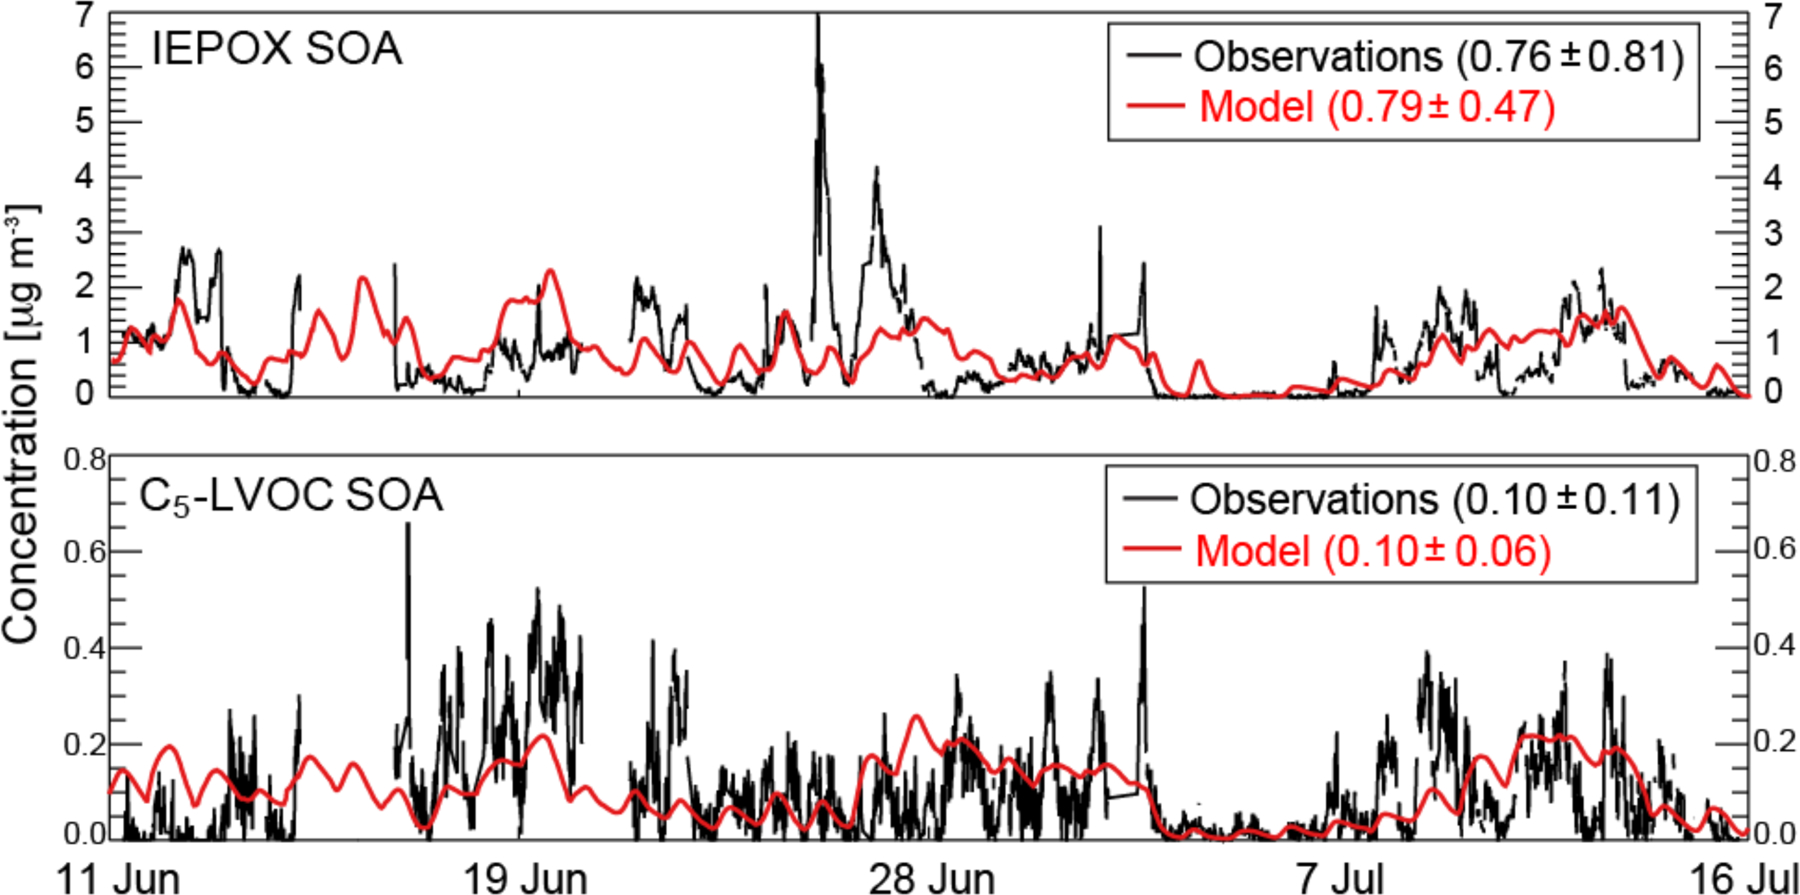
Figure 4.

Time series of the concentrations of isoprene SOA components at the SOAS site in Centreville, Alabama (32.94°N; 87.18°W) in June–July 2013: measured (black) and modeled (red) IEPOX SOA (top) and C5-LVOC SOA (bottom) mass concentrations. Means and 1σ standard deviations are given for the observations and the model.
