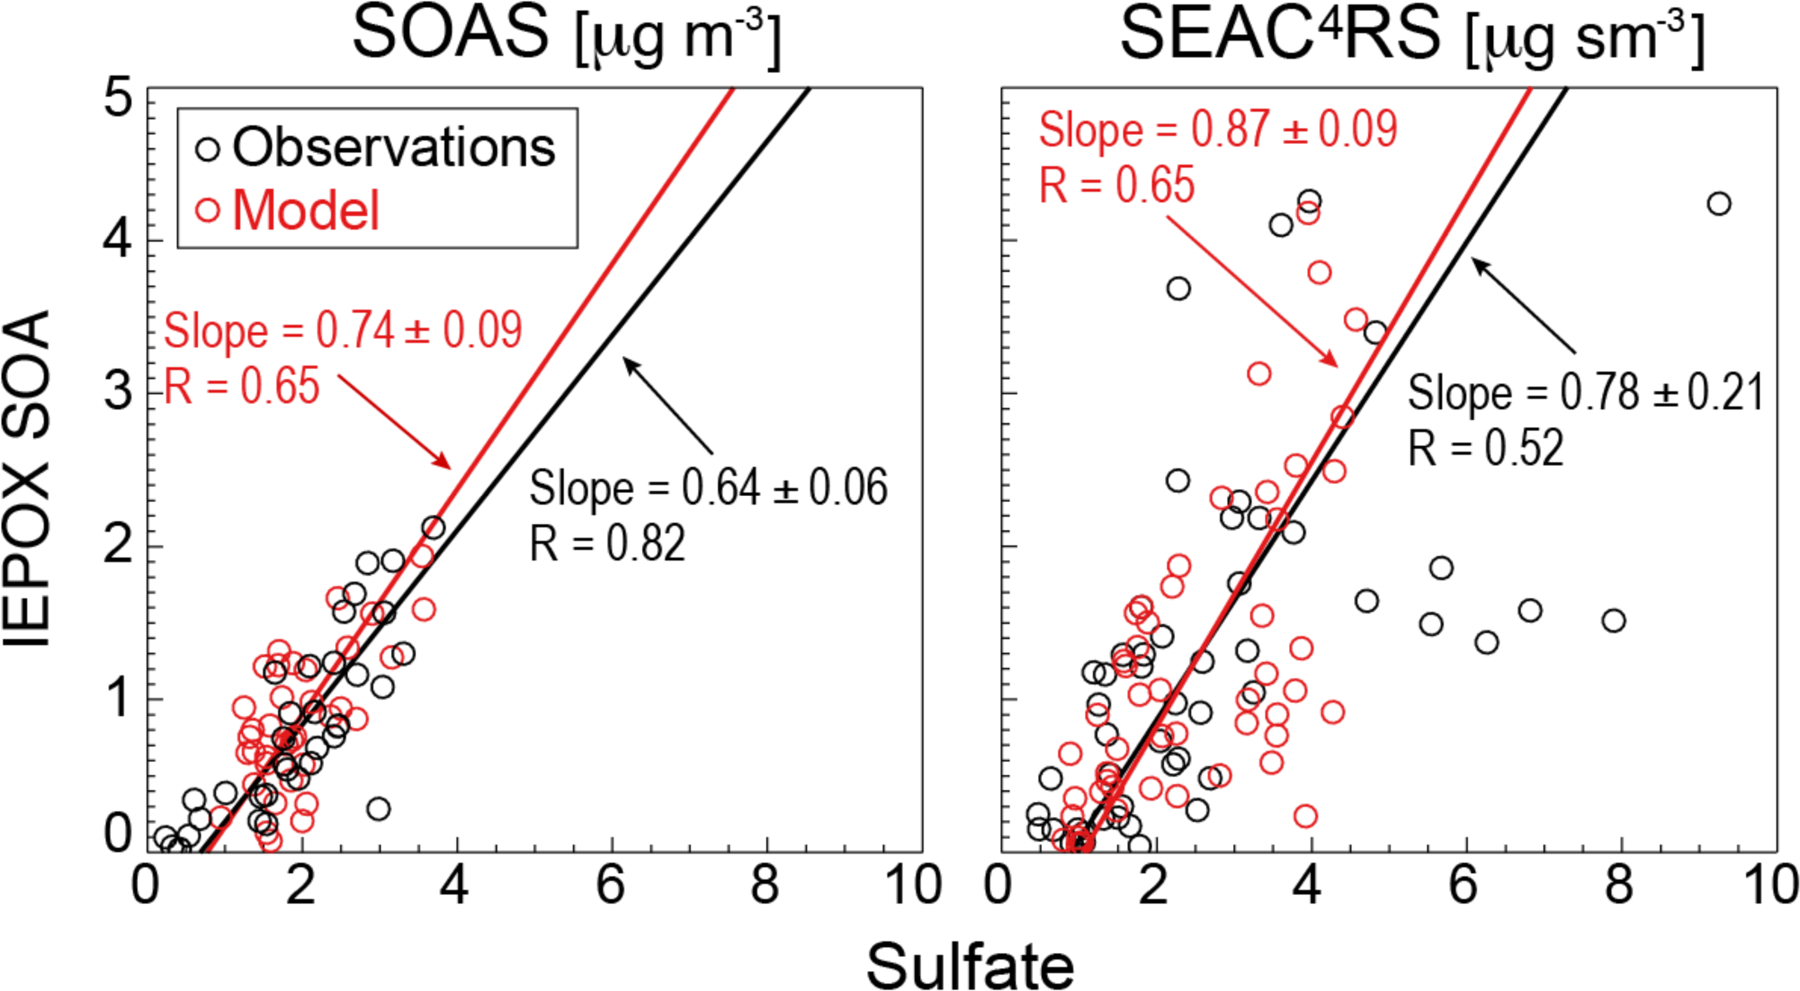
Figure 5.

Relationship of IEPOX SOA and sulfate concentrations over the Southeast US in summer. Observed (black) and simulated (red) data are averages for each campaign day during SOAS (left), and boundary layer averages (< 2 km) for 2° × 2.5° GEOS-Chem grid squares on individual flight days during SEAC4RS (right). RMA regression slopes and Pearson’s correlation coefficients are shown. 1σ standard deviations on the regression slopes are obtained with jackknife resampling.
