
Figure 6.
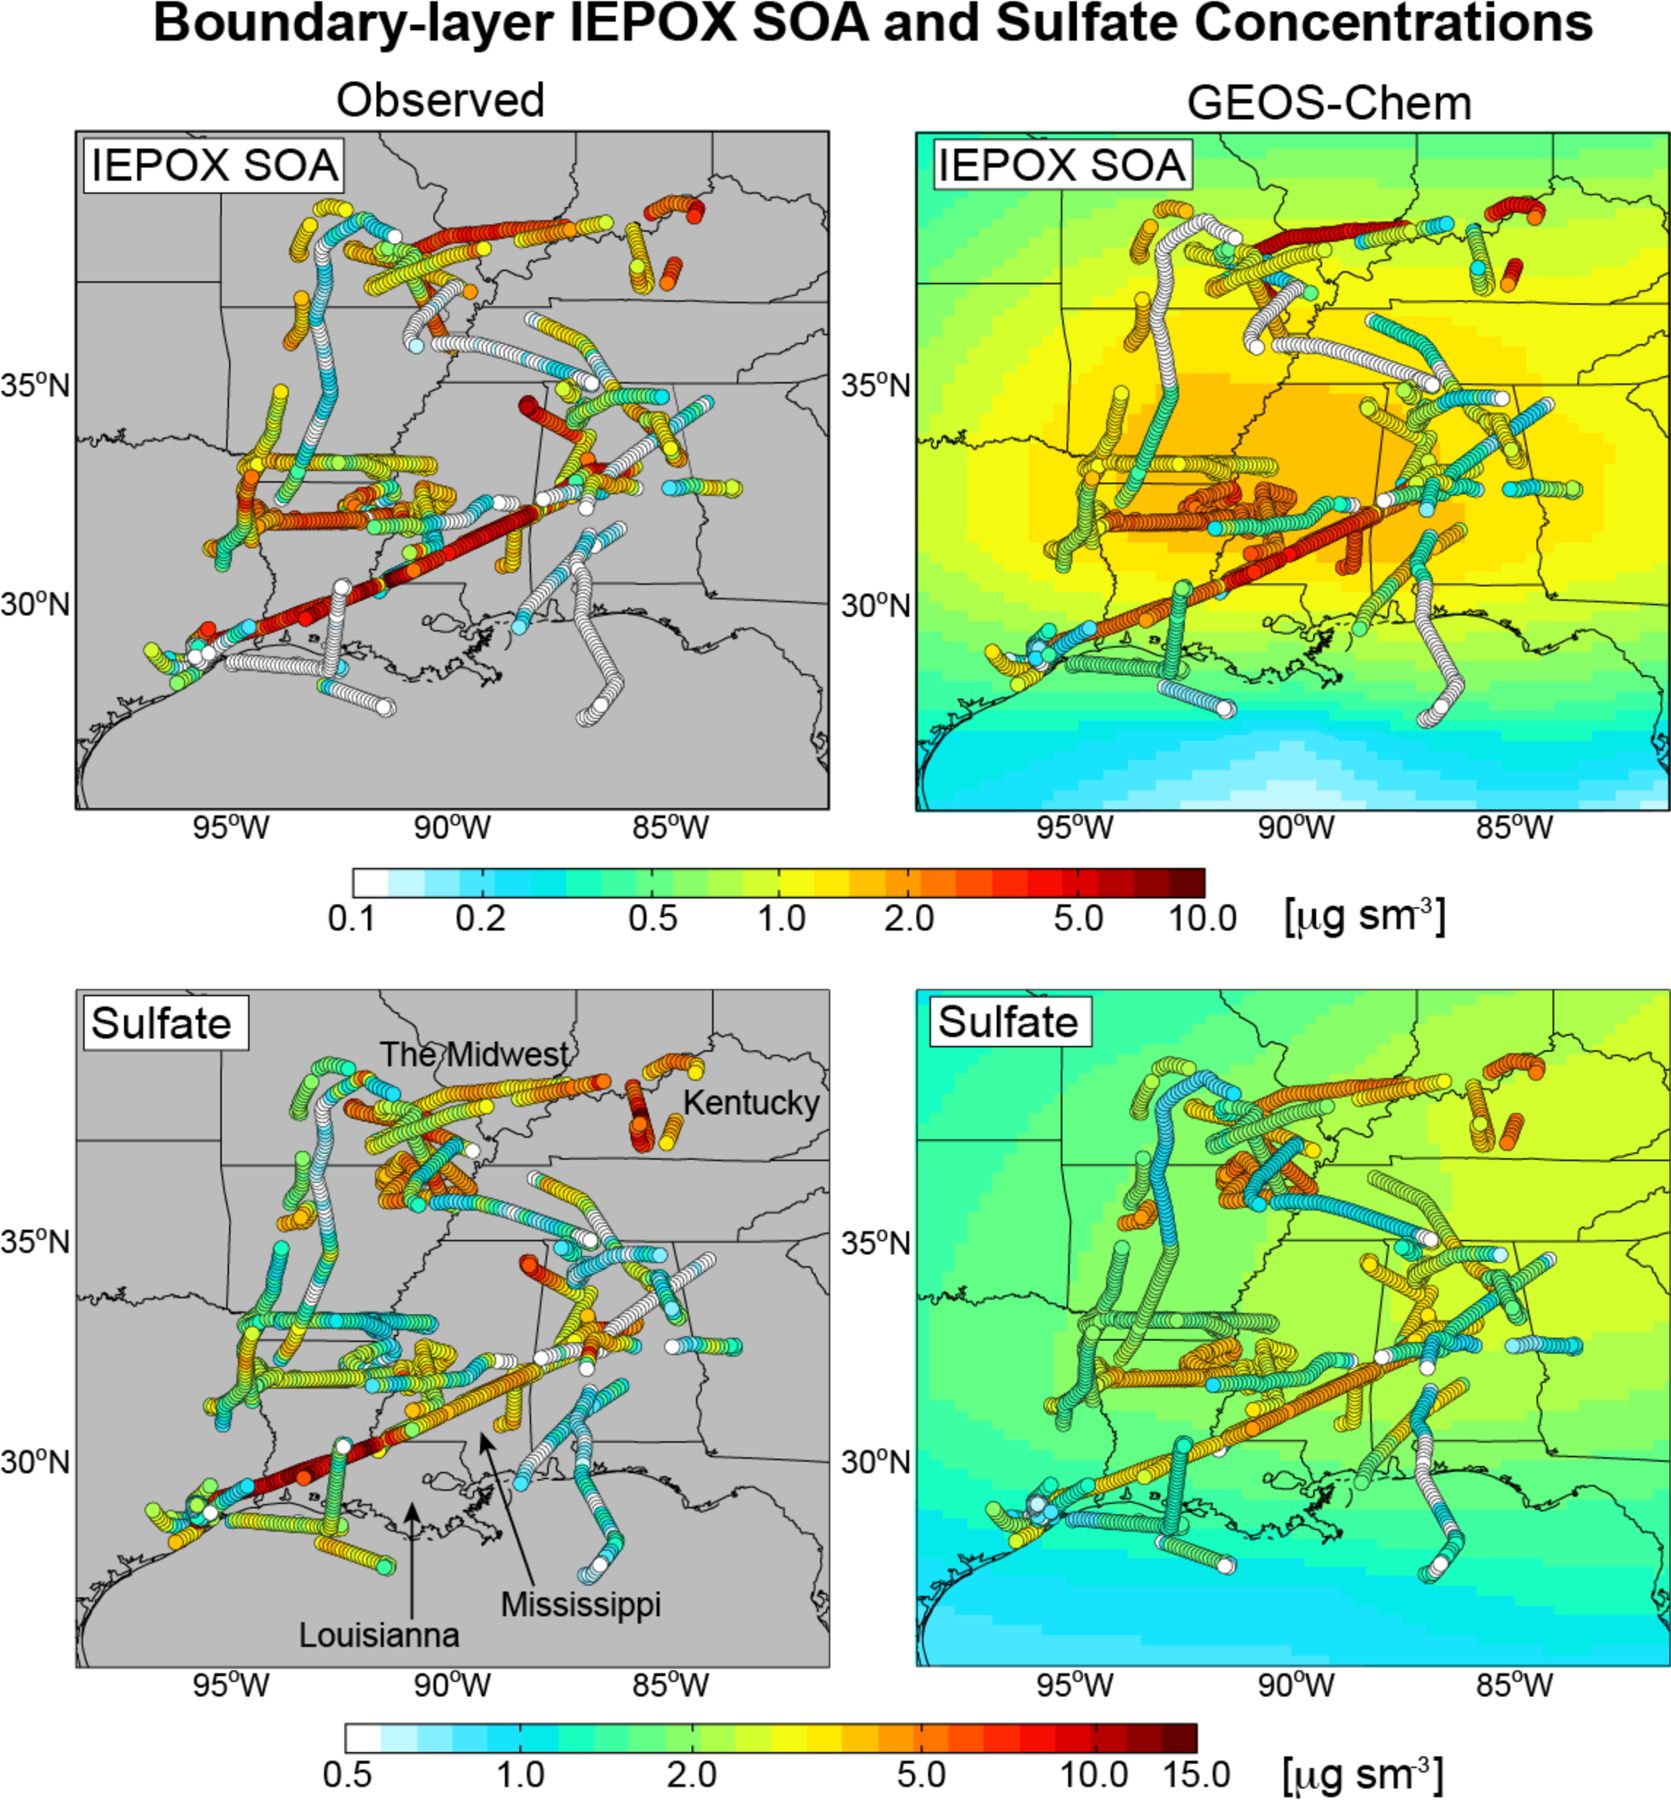
Spatial distributions of IEPOX SOA and sulfate concentrations in the boundary layer (<2 km) over the Southeast US during SEAC4RS (August–September 2013). Aircraft AMS observations of IEPOX SOA (top left) and sulfate (bottom left) are compared to model values sampled at the time and location of the aircraft observations (individual points) and averaged during the SEAC4RS period (background contours). Data are on a logarithmic scale.