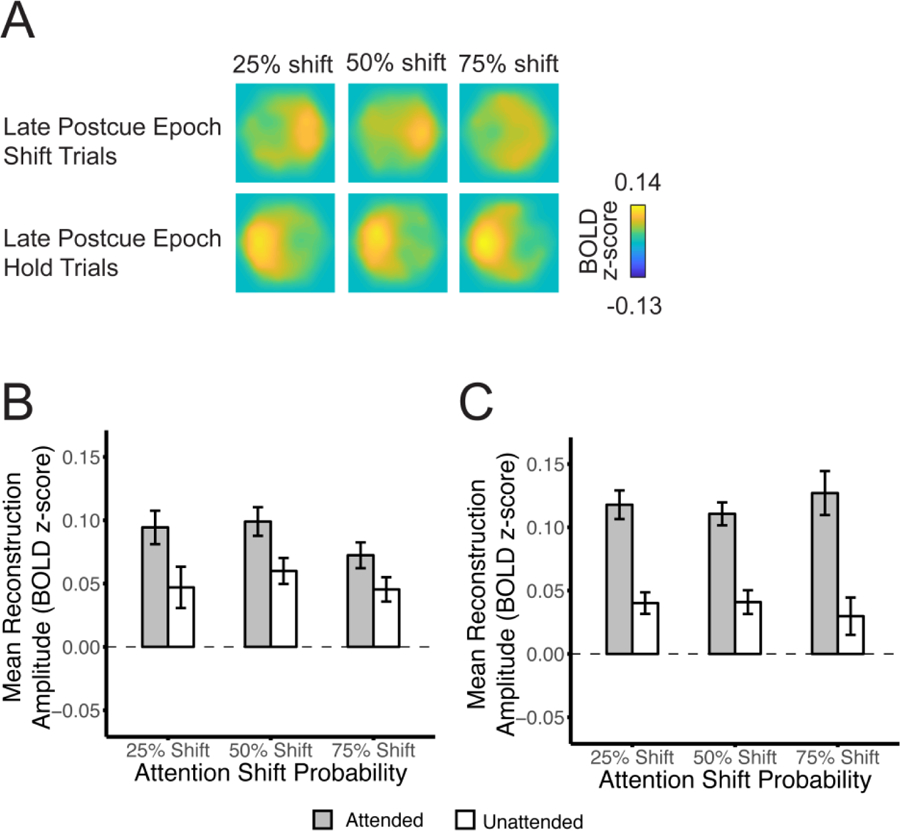
Figure 8.

(A) Spatial reconstructions from 6–8 seconds after the cue onset as a function of probability context and cue type. (B) Average amplitudes at the cued and non-cued locations for shift trials, and (C) for hold trials. Attended refers to the right target square for shift trials and the left target square for hold trials. Error bars denote 1 between-subjects SEM.
