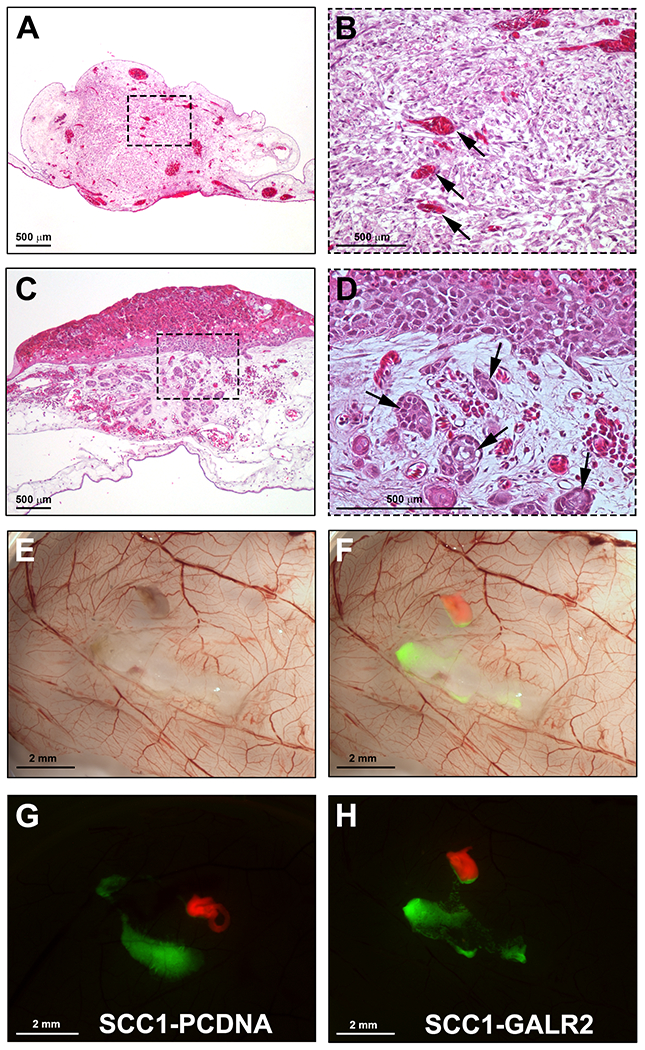
Figure 5: Representative results.

A. H&E section showing integration of the DRG in the CAM. B. Higher magnification of A; arrows show CAM blood vessels in the DRG. C. UM-SCC-1 cells grafted onto the CAM and harvested four days after grafting (H&E stain). D. Higher magnification of C showing invasive tumor islands in the CAM connective tissue (arrows). E. Gross stereomicroscopic image of the CAM grafted with UM-SCC-1-GALR2 cells and rat DRG, harvested on day 17. F. Merged fluorescence and brightfield images highlighting the DRG labeled in red and cancer cells labeled in green. G-H. Fluorescence stereomicroscopy of the CAM grafted with DRG and UM-SCC-1-GALR2 versus control cells, illustrating directional invasion of UM-SCC-1-GALR2 cells to the DRG (H). Scale bars: A-D, 500 μm; E-H, 2 mm.
