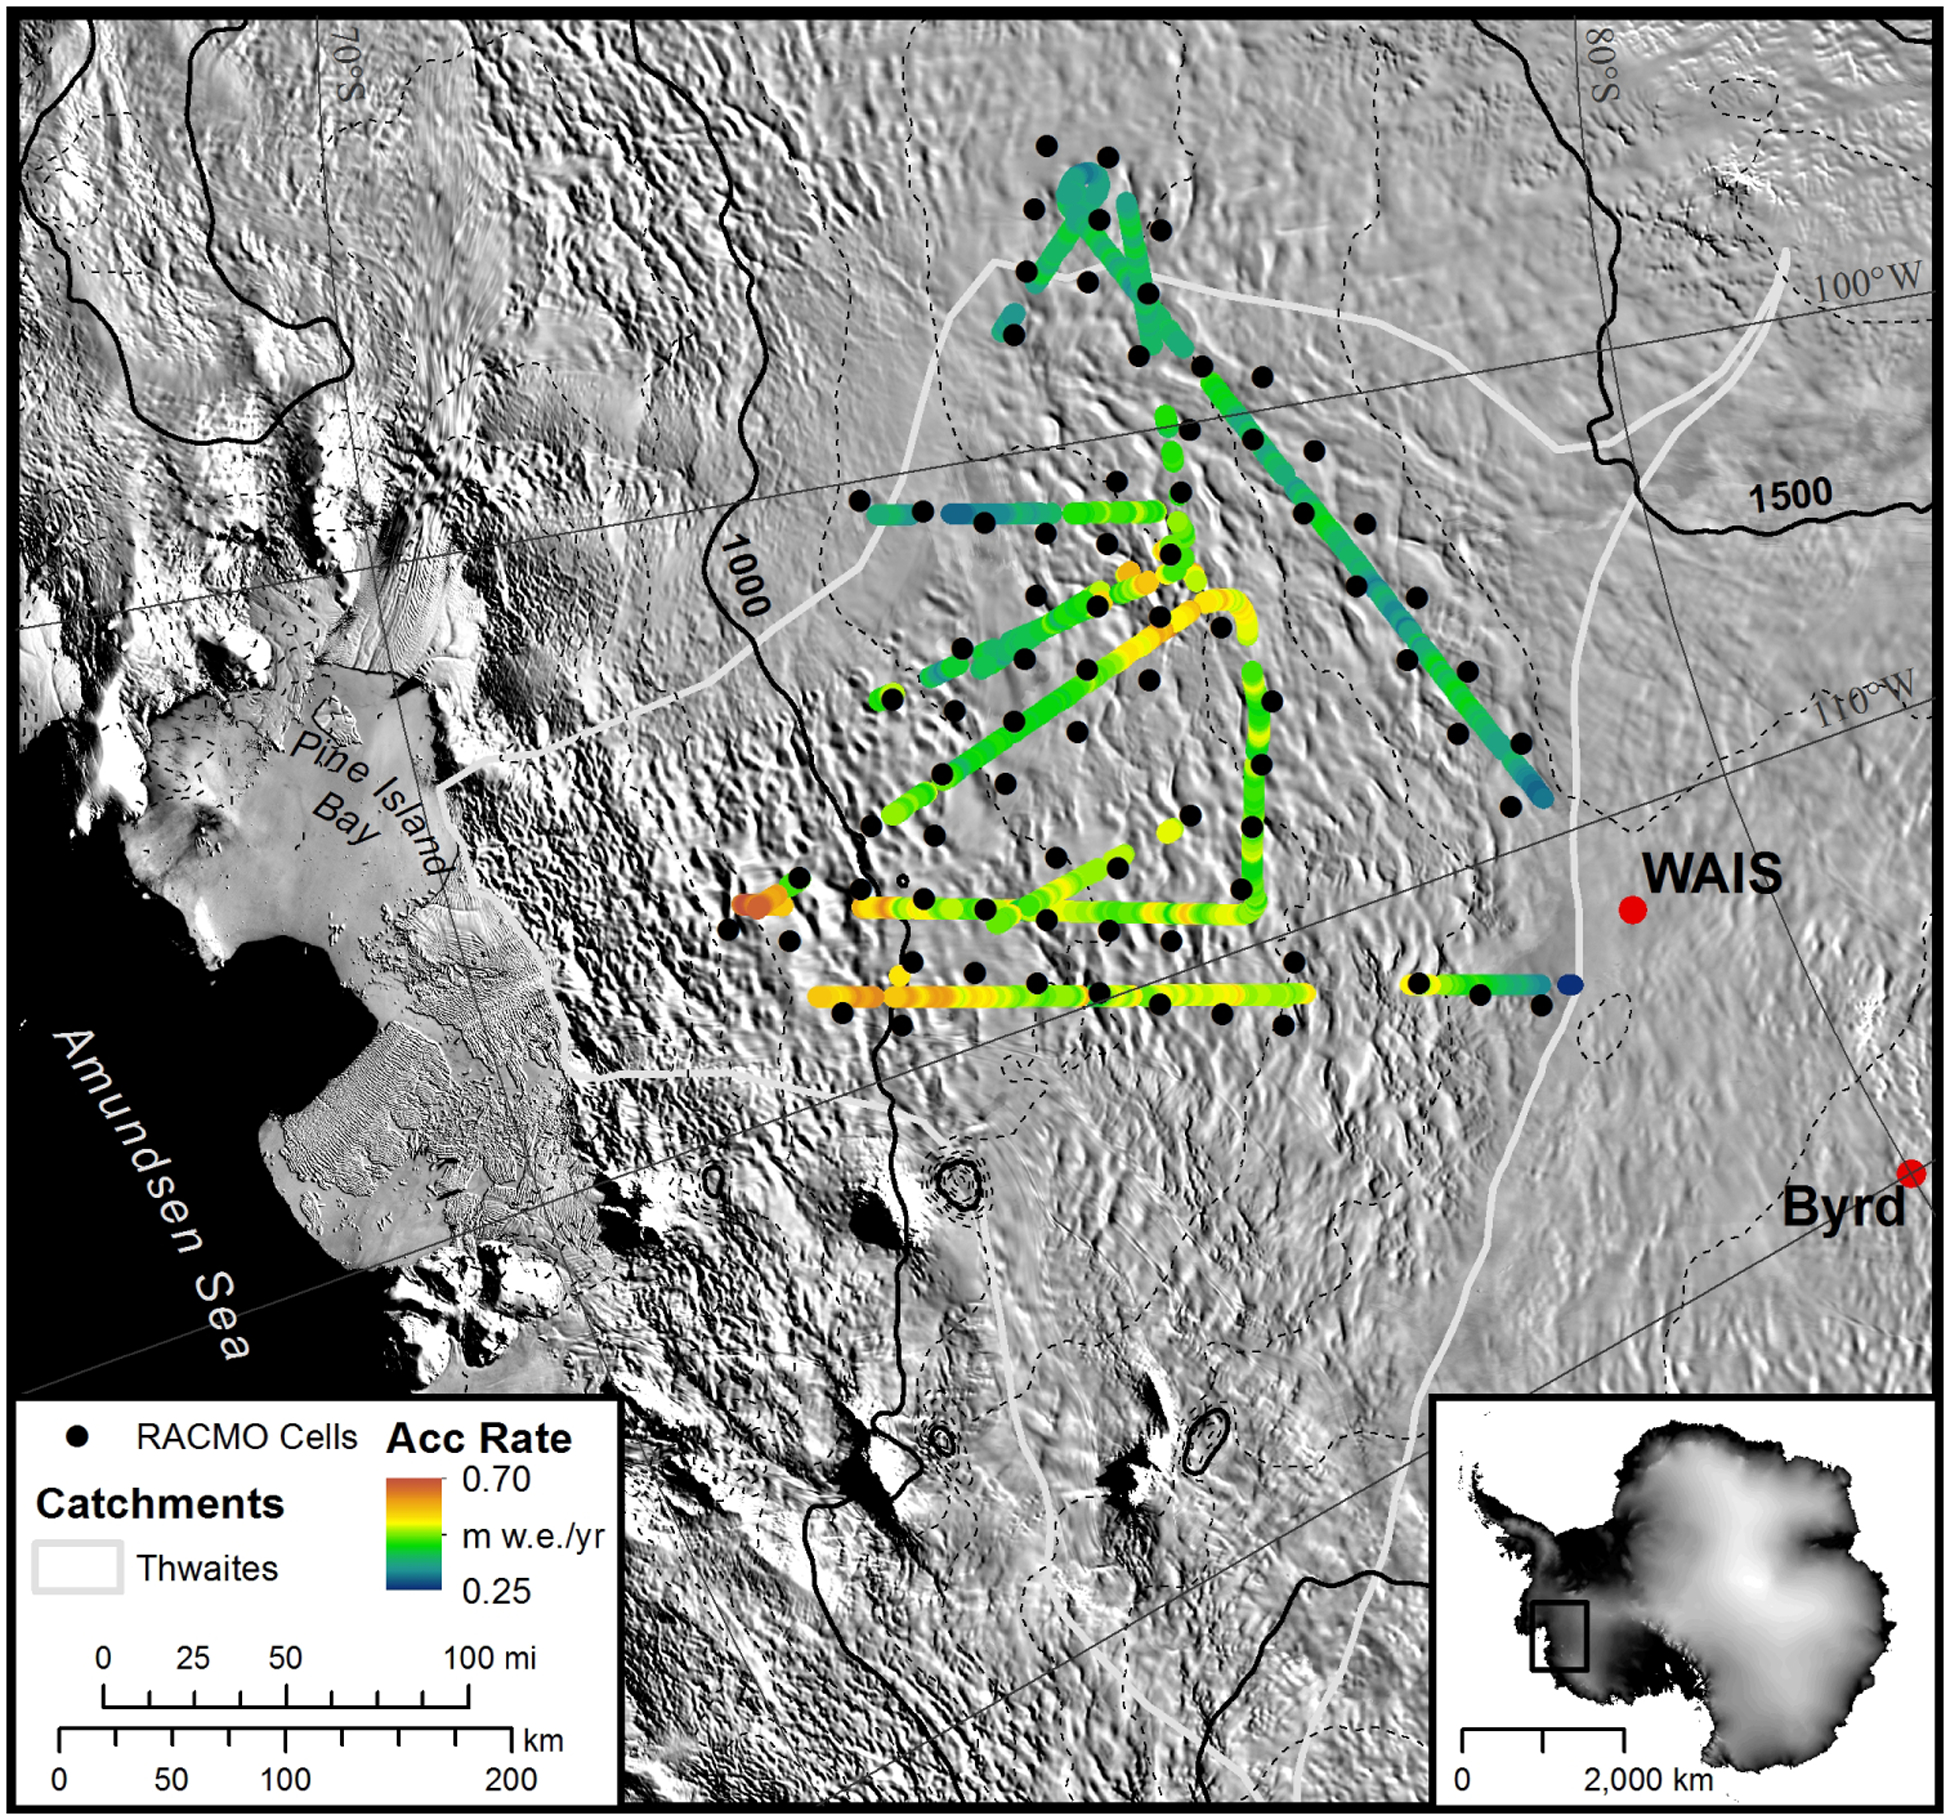
Fig. 2.

Map of the study area, including catchment delineation (white line), elevation contours (black lines), radar-derived SMB and the location of the RACMO grid points used for comparison (black dots). The background image is de MODIS Mosaic of Antarctica (Scambos et al., 2007).
