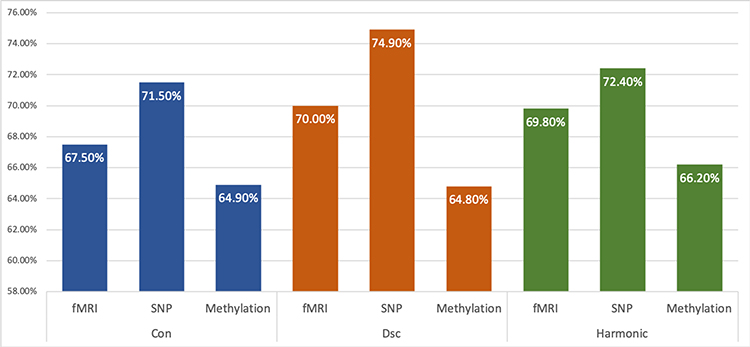
Fig. 4:
A comparison of SZ classification accuracy (100% minus testing error) using single type of omics data with different graph-based method. From left to right: 1. ‘Con’: GSSL with fully connected graphs; 2. ‘Dsc’: GSSL with disconnected graphs where each subgraph has at least one labelled node;3. ‘Harmonic’: harmonic function proposed in [13] with disconnected graphs where each subgraph has at least one labelled node.

