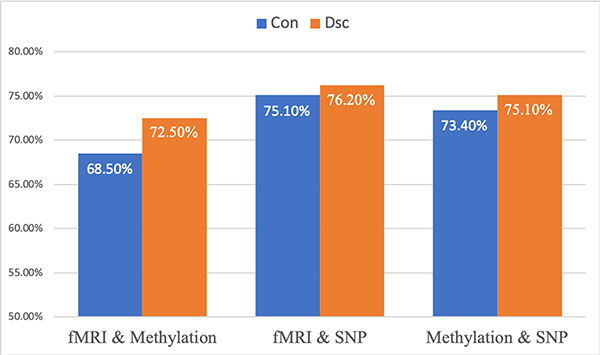
Fig. 5:
SZ classification accuracy (100% minus testing error) with pair-wise combination of omics data. From left to right: optimized combination : 1. fMRI and DNA methylation data; 2. fMRI and SNP data; 3. DNA methylation and SNP data. Blue and orange bars correspond to fully-connected graphs and disconnected graphs, respectively.

